APS 2015 Annual Report Download - page 149
Download and view the complete annual report
Please find page 149 of the 2015 APS annual report below. You can navigate through the pages in the report by either clicking on the pages listed below, or by using the keyword search tool below to find specific information within the annual report.-
 1
1 -
2
-
3
-
4
-
5
-
6
-
7
-
8
-
9
-
10
-
11
-
12
-
13
-
14
-
15
-
16
-
17
-
18
-
19
-
20
-
21
-
22
-
23
-
24
-
25
-
26
-
27
-
28
-
29
-
30
-
31
-
32
-
33
-
34
-
35
-
36
-
37
-
38
-
39
-
40
-
41
-
42
-
43
-
44
-
45
-
46
-
47
-
48
-
49
-
50
-
51
-
52
-
53
-
54
-
55
-
56
-
57
-
58
-
59
-
60
-
61
-
62
-
63
-
64
-
65
-
66
-
67
-
68
-
69
-
70
-
71
-
72
-
73
-
74
-
75
-
76
-
77
-
78
-
79
-
80
-
81
-
82
-
83
-
84
-
85
-
86
-
87
-
88
-
89
-
90
-
91
-
92
-
93
-
94
-
95
-
96
-
97
-
98
-
99
-
100
-
101
-
102
-
103
-
104
-
105
-
106
-
107
-
108
-
109
-
110
-
111
-
112
-
113
-
114
-
115
-
116
-
117
-
118
-
119
-
120
-
121
-
122
-
123
-
124
-
125
-
126
-
127
-
128
-
129
-
130
-
131
-
132
-
133
-
134
-
135
-
136
-
137
-
138
-
 139
139 -
 140
140 -
 141
141 -
 142
142 -
 143
143 -
 144
144 -
 145
145 -
 146
146 -
 147
147 -
 148
148 -
 149
149 -
 150
150 -
 151
151 -
 152
152 -
 153
153 -
 154
154 -
 155
155 -
 156
156 -
 157
157 -
 158
158 -
 159
159 -
160
-
161
-
162
-
163
-
164
-
165
-
166
-
167
-
168
-
169
-
170
-
171
-
172
-
173
-
174
-
175
-
176
-
177
-
178
-
179
-
180
-
181
-
182
-
183
-
184
-
185
-
186
-
187
-
188
-
189
-
190
-
191
-
192
-
193
-
194
-
195
-
196
-
197
-
198
-
199
-
200
-
201
-
202
-
203
-
204
-
205
-
206
-
207
-
208
-
209
-
210
-
211
-
212
-
213
-
214
-
215
-
216
-
217
-
218
-
219
-
220
-
221
-
222
-
223
-
224
-
225
-
226
-
227
-
228
-
229
-
230
-
231
-
232
-
233
-
234
-
235
-
236
-
237
-
238
-
239
-
240
-
241
-
242
-
243
-
244
-
245
-
246
-
247
-
248
-
249
-
250
-
251
-
252
-
253
-
254
-
255
-
256
-
257
-
258
-
259
-
260
-
261
-
262
-
263
-
264
 |
 |

Table of Contents
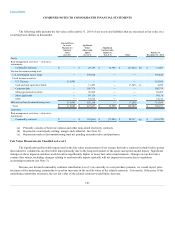
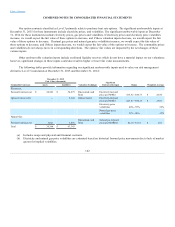
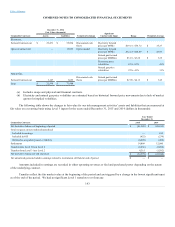
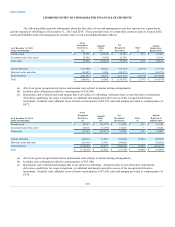
COMBINED NOTES TO CONSOLIDATED FINANCIAL STATEMENTS
other hierarchy level. Transfers in or out of Level 3 are typically related to our long-dated energy transactions that extend beyond
available quoted periods.
Financial Instruments Not Carried at Fair Value
The carrying value of our net accounts receivable, accounts payable and short-term borrowings approximate fair value. Our
short-term borrowings are classified within Level 2 of the fair value hierarchy. See Note 6 for our long-term debt fair values.
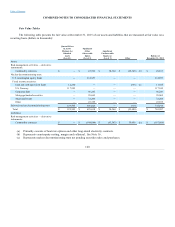
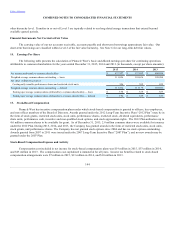
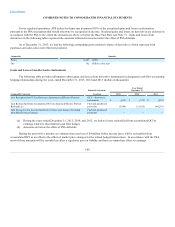
14. Earnings Per Share
The following table presents the calculation of Pinnacle West’s basic and diluted earnings per share for continuing operations
attributable to common shareholders for the years ended December 31, 2015, 2014 and 2013 (in thousands, except per share amounts):
2015
2014
2013
Net income attributable to common shareholders $ 437,257
$ 397,595
$ 406,074
Weighted average common shares outstanding — basic 111,026
110,626
109,984
Net effect of dilutive securities:
Contingently issuable performance shares and restricted stock units 526
552
822
Weighted average common shares outstanding — diluted 111,552
111,178
110,806
Earnings per average common share attributable to common shareholders — basic $ 3.94
$ 3.59
$ 3.69
Earnings per average common share attributable to common shareholders — diluted $ 3.92
$ 3.58
$ 3.66
15. Stock-Based Compensation
Pinnacle West has incentive compensation plans under which stock-based compensation is granted to officers, key-employees,
and non-officer members of the Board of Directors. Awards granted under the 2012 Long-Term Incentive Plan (“2012 Plan”) may be in
the form of stock grants, restricted stock units, stock units, performance shares, restricted stock, dividend equivalents, performance
share units, performance cash, incentive and non-qualified stock options, and stock appreciation rights. The 2012 Plan authorizes up to
4.6 million common shares to be available for grant. As of December 31, 2015, 2.8 million common shares were available for issuance
under the 2012 Plan. During 2015, 2014, and 2013, the Company has granted awards in the form of restricted stock units, stock units,
stock grants, and performance shares. The Company has not granted stock options since 2004 and has no stock options outstanding.
Awards granted from 2007 to 2011 were issued under the 2007 Long-Term Incentive Plan (“2007 Plan”), and no new awards may be
granted under the 2007 Plan.
Stock-Based Compensation Expense and Activity
Compensation cost included in net income for stock-based compensation plans was $19 million in 2015, $33 million in 2014,
and $25 million in 2013. The compensation cost capitalized is immaterial for all years. Income tax benefits related to stock-based
compensation arrangements were $7 million in 2015, $13 million in 2014, and $10 million in 2013.
144