APS 2015 Annual Report Download - page 102
Download and view the complete annual report
Please find page 102 of the 2015 APS annual report below. You can navigate through the pages in the report by either clicking on the pages listed below, or by using the keyword search tool below to find specific information within the annual report.-
 1
1 -
2
-
3
-
4
-
5
-
6
-
7
-
8
-
9
-
10
-
11
-
12
-
13
-
14
-
15
-
16
-
17
-
18
-
19
-
20
-
21
-
22
-
23
-
24
-
25
-
26
-
27
-
28
-
29
-
30
-
31
-
32
-
33
-
34
-
35
-
36
-
37
-
38
-
39
-
40
-
41
-
42
-
43
-
44
-
45
-
46
-
47
-
48
-
49
-
50
-
51
-
52
-
53
-
54
-
55
-
56
-
57
-
58
-
59
-
60
-
61
-
62
-
63
-
64
-
65
-
66
-
67
-
68
-
69
-
70
-
71
-
72
-
73
-
74
-
75
-
76
-
77
-
78
-
79
-
80
-
81
-
82
-
83
-
84
-
85
-
86
-
87
-
88
-
89
-
90
-
91
-
 92
92 -
 93
93 -
 94
94 -
 95
95 -
 96
96 -
 97
97 -
 98
98 -
 99
99 -
 100
100 -
 101
101 -
 102
102 -
 103
103 -
 104
104 -
 105
105 -
 106
106 -
 107
107 -
 108
108 -
 109
109 -
 110
110 -
 111
111 -
 112
112 -
113
-
114
-
115
-
116
-
117
-
118
-
119
-
120
-
121
-
122
-
123
-
124
-
125
-
126
-
127
-
128
-
129
-
130
-
131
-
132
-
133
-
134
-
135
-
136
-
137
-
138
-
139
-
140
-
141
-
142
-
143
-
144
-
145
-
146
-
147
-
148
-
149
-
150
-
151
-
152
-
153
-
154
-
155
-
156
-
157
-
158
-
159
-
160
-
161
-
162
-
163
-
164
-
165
-
166
-
167
-
168
-
169
-
170
-
171
-
172
-
173
-
174
-
175
-
176
-
177
-
178
-
179
-
180
-
181
-
182
-
183
-
184
-
185
-
186
-
187
-
188
-
189
-
190
-
191
-
192
-
193
-
194
-
195
-
196
-
197
-
198
-
199
-
200
-
201
-
202
-
203
-
204
-
205
-
206
-
207
-
208
-
209
-
210
-
211
-
212
-
213
-
214
-
215
-
216
-
217
-
218
-
219
-
220
-
221
-
222
-
223
-
224
-
225
-
226
-
227
-
228
-
229
-
230
-
231
-
232
-
233
-
234
-
235
-
236
-
237
-
238
-
239
-
240
-
241
-
242
-
243
-
244
-
245
-
246
-
247
-
248
-
249
-
250
-
251
-
252
-
253
-
254
-
255
-
256
-
257
-
258
-
259
-
260
-
261
-
262
-
263
-
264
 |
 |
Table of Contents
COMBINED NOTES TO CONSOLIDATED FINANCIAL STATEMENTS
an offsetting regulatory liability through the settlement period ending December of 2016. See Note 10 for information on spent nuclear
fuel disposal costs.
Income Taxes
Income taxes are provided using the asset and liability approach prescribed by guidance relating to accounting for income
taxes. We file our federal income tax return on a consolidated basis, and we file our state income tax returns on a consolidated or
unitary basis. In accordance with our intercompany tax sharing agreement, federal and state income taxes are allocated to each first-tier
subsidiary as though each first-tier subsidiary filed a separate income tax return. Any difference between that method and the
consolidated (and unitary) income tax liability is attributed to the parent company. The income tax accounts reflect the tax and interest
associated with management’s estimate of the largest amount of tax benefit that is greater than 50% likely of being realized upon
settlement for all known and measurable tax exposures (see Note 4).
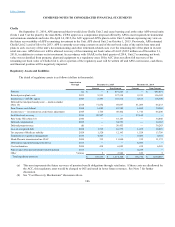
Cash and Cash Equivalents
We consider all highly liquid investments with a remaining maturity of three months or less at acquisition to be cash
equivalents.
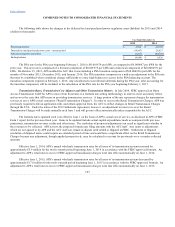
The following table summarizes supplemental Pinnacle West cash flow information for each of the last three years (dollars in
thousands):
Year ended December 31,
2015
2014
2013
Cash paid (received) during the period for:
Income taxes, net of refunds $ 6,550
$ (102,154)
$ 18,537
Interest, net of amounts capitalized 170,209
177,074
184,010
Significant non-cash investing and financing activities:
Accrued capital expenditures $ 83,798
$ 44,712
$ 33,184
Dividends declared but not paid 69,363
65,790
62,528
Liabilities assumed relating to acquisition of SCE Four Corners’ interest (see Note 3) —
—
145,609
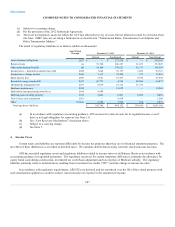
Intangible Assets
We have no goodwill recorded and have separately disclosed other intangible assets, primarily APS's software, on
Pinnacle West’s Consolidated Balance Sheets. The intangible assets are amortized over their finite useful lives. Amortization expense
was $58 million in 2015, $53 million in 2014, and $53 million in 2013. Estimated amortization expense on existing intangible assets
over the next five years is $48 million in 2016, $36 million in 2017, $18 million in 2018, $9 million in 2019, and $3 million in 2020.
At December 31, 2015, the weighted-average remaining amortization period for intangible assets was 5 years.
Investments
El Dorado accounts for its investments using either the equity method (if significant influence) or the cost method (if less than
20% ownership and no significant influence).
97