APS 2015 Annual Report Download - page 57
Download and view the complete annual report
Please find page 57 of the 2015 APS annual report below. You can navigate through the pages in the report by either clicking on the pages listed below, or by using the keyword search tool below to find specific information within the annual report.-
 1
1 -
2
-
3
-
4
-
5
-
6
-
7
-
8
-
9
-
10
-
11
-
12
-
13
-
14
-
15
-
16
-
17
-
18
-
19
-
20
-
21
-
22
-
23
-
24
-
25
-
26
-
27
-
28
-
29
-
30
-
31
-
32
-
33
-
34
-
35
-
36
-
37
-
38
-
39
-
40
-
41
-
42
-
43
-
44
-
45
-
46
-
 47
47 -
 48
48 -
 49
49 -
 50
50 -
 51
51 -
 52
52 -
 53
53 -
 54
54 -
 55
55 -
 56
56 -
 57
57 -
 58
58 -
 59
59 -
 60
60 -
 61
61 -
 62
62 -
 63
63 -
 64
64 -
 65
65 -
 66
66 -
 67
67 -
68
-
69
-
70
-
71
-
72
-
73
-
74
-
75
-
76
-
77
-
78
-
79
-
80
-
81
-
82
-
83
-
84
-
85
-
86
-
87
-
88
-
89
-
90
-
91
-
92
-
93
-
94
-
95
-
96
-
97
-
98
-
99
-
100
-
101
-
102
-
103
-
104
-
105
-
106
-
107
-
108
-
109
-
110
-
111
-
112
-
113
-
114
-
115
-
116
-
117
-
118
-
119
-
120
-
121
-
122
-
123
-
124
-
125
-
126
-
127
-
128
-
129
-
130
-
131
-
132
-
133
-
134
-
135
-
136
-
137
-
138
-
139
-
140
-
141
-
142
-
143
-
144
-
145
-
146
-
147
-
148
-
149
-
150
-
151
-
152
-
153
-
154
-
155
-
156
-
157
-
158
-
159
-
160
-
161
-
162
-
163
-
164
-
165
-
166
-
167
-
168
-
169
-
170
-
171
-
172
-
173
-
174
-
175
-
176
-
177
-
178
-
179
-
180
-
181
-
182
-
183
-
184
-
185
-
186
-
187
-
188
-
189
-
190
-
191
-
192
-
193
-
194
-
195
-
196
-
197
-
198
-
199
-
200
-
201
-
202
-
203
-
204
-
205
-
206
-
207
-
208
-
209
-
210
-
211
-
212
-
213
-
214
-
215
-
216
-
217
-
218
-
219
-
220
-
221
-
222
-
223
-
224
-
225
-
226
-
227
-
228
-
229
-
230
-
231
-
232
-
233
-
234
-
235
-
236
-
237
-
238
-
239
-
240
-
241
-
242
-
243
-
244
-
245
-
246
-
247
-
248
-
249
-
250
-
251
-
252
-
253
-
254
-
255
-
256
-
257
-
258
-
259
-
260
-
261
-
262
-
263
-
264
 |
 |

Table of Contents
continues to pursue transmission development opportunities in the western United States consistent with its strategy.
El Dorado. The operations of El Dorado are not expected to have any material impact on our financial results, or to require any
material amounts of capital, over the next three years.
Key Financial Drivers
In addition to the continuing impact of the matters described above, many factors influence our financial results and our future
financial outlook, including those listed below. We closely monitor these factors to plan for the Company’s current needs, and to adjust
our expectations, financial budgets and forecasts appropriately.
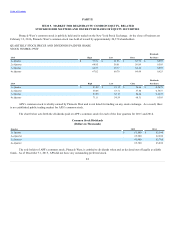
Electric Operating Revenues. For the years 2013 through 2015, retail electric revenues comprised approximately 93% of our
total electric operating revenues. Our electric operating revenues are affected by customer growth or decline, variations in weather
from period to period, customer mix, average usage per customer and the impacts of energy efficiency programs, distributed energy
additions, electricity rates and tariffs, the recovery of PSA deferrals and the operation of other recovery mechanisms. These revenue
transactions are affected by the availability of excess generation or other energy resources and wholesale market conditions, including
competition, demand and prices.
Customer and Sales Growth. Retail customers in APS’s service territory increased 1.2% for the year ended December 31, 2015
compared with the prior year. For the three years 2013 through 2015, APS’s customer growth averaged 1.3% per year. We currently
expect annual customer growth to average in the range of 2.0-3.0% for 2016 through 2018 based on our assessment of modestly
improving economic conditions in Arizona. Retail electricity sales in kWh, adjusted to exclude the effects of weather variations,
increased 0.7% for the year ended December 31, 2015 compared with the prior year, reflecting the effects of improving economic
conditions and customer growth, partially offset by customer conservation and energy efficiency and distributed renewable generation
initiatives. For the three years 2013 through 2015, APS experienced annual increases in retail electricity sales averaging 0.1%, adjusted
to exclude the effects of weather variations. We currently estimate that annual retail electricity sales in kWh will increase on average in
the range of 0.5-1.5% during 2016 through 2018, including the effects of customer conservation and energy efficiency and distributed
renewable generation initiatives, but excluding the effects of weather variations. A slower recovery of the Arizona economy could
further impact these estimates.
Actual sales growth, excluding weather-related variations, may differ from our projections as a result of numerous factors, such
as economic conditions, customer growth, usage patterns and energy conservation, impacts of energy efficiency programs and growth
in distributed generation, and responses to retail price changes. Based on past experience, a reasonable range of variation in our kWh
sales projections attributable to such economic factors under normal business conditions can result in increases or decreases in annual
net income of up to $10 million.
Weather. In forecasting the retail sales growth numbers provided above, we assume normal weather patterns based on historical
data. Historically, extreme weather variations have resulted in annual variations in net income in excess of $20 million. However, our
experience indicates that the more typical variations from normal weather can result in increases or decreases in annual net income of
up to $10 million.
Fuel and Purchased Power Costs. Fuel and purchased power costs included on our Consolidated Statements of Income are
impacted by our electricity sales volumes, existing contracts for purchased power and generation fuel, our power plant performance,
transmission availability or constraints, prevailing market
54