APS 2015 Annual Report Download - page 142
Download and view the complete annual report
Please find page 142 of the 2015 APS annual report below. You can navigate through the pages in the report by either clicking on the pages listed below, or by using the keyword search tool below to find specific information within the annual report.-
 1
1 -
2
-
3
-
4
-
5
-
6
-
7
-
8
-
9
-
10
-
11
-
12
-
13
-
14
-
15
-
16
-
17
-
18
-
19
-
20
-
21
-
22
-
23
-
24
-
25
-
26
-
27
-
28
-
29
-
30
-
31
-
32
-
33
-
34
-
35
-
36
-
37
-
38
-
39
-
40
-
41
-
42
-
43
-
44
-
45
-
46
-
47
-
48
-
49
-
50
-
51
-
52
-
53
-
54
-
55
-
56
-
57
-
58
-
59
-
60
-
61
-
62
-
63
-
64
-
65
-
66
-
67
-
68
-
69
-
70
-
71
-
72
-
73
-
74
-
75
-
76
-
77
-
78
-
79
-
80
-
81
-
82
-
83
-
84
-
85
-
86
-
87
-
88
-
89
-
90
-
91
-
92
-
93
-
94
-
95
-
96
-
97
-
98
-
99
-
100
-
101
-
102
-
103
-
104
-
105
-
106
-
107
-
108
-
109
-
110
-
111
-
112
-
113
-
114
-
115
-
116
-
117
-
118
-
119
-
120
-
121
-
122
-
123
-
124
-
125
-
126
-
127
-
128
-
129
-
130
-
131
-
 132
132 -
 133
133 -
 134
134 -
 135
135 -
 136
136 -
 137
137 -
 138
138 -
 139
139 -
 140
140 -
 141
141 -
 142
142 -
 143
143 -
 144
144 -
 145
145 -
 146
146 -
 147
147 -
 148
148 -
 149
149 -
 150
150 -
 151
151 -
 152
152 -
153
-
154
-
155
-
156
-
157
-
158
-
159
-
160
-
161
-
162
-
163
-
164
-
165
-
166
-
167
-
168
-
169
-
170
-
171
-
172
-
173
-
174
-
175
-
176
-
177
-
178
-
179
-
180
-
181
-
182
-
183
-
184
-
185
-
186
-
187
-
188
-
189
-
190
-
191
-
192
-
193
-
194
-
195
-
196
-
197
-
198
-
199
-
200
-
201
-
202
-
203
-
204
-
205
-
206
-
207
-
208
-
209
-
210
-
211
-
212
-
213
-
214
-
215
-
216
-
217
-
218
-
219
-
220
-
221
-
222
-
223
-
224
-
225
-
226
-
227
-
228
-
229
-
230
-
231
-
232
-
233
-
234
-
235
-
236
-
237
-
238
-
239
-
240
-
241
-
242
-
243
-
244
-
245
-
246
-
247
-
248
-
249
-
250
-
251
-
252
-
253
-
254
-
255
-
256
-
257
-
258
-
259
-
260
-
261
-
262
-
263
-
264
 |
 |

Table of Contents
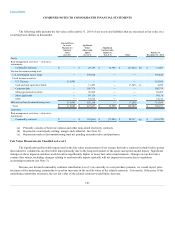
COMBINED NOTES TO CONSOLIDATED FINANCIAL STATEMENTS
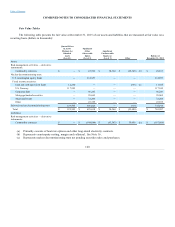
Selected Quarterly Financial Data (Unaudited) - APS
APS's quarterly financial information for 2015 and 2014 is as follows (dollars in thousands):
2015 Quarter Ended,
2015
March 31,
June 30,
September 30,
December 31,
Total
Operating revenues $ 670,668
$ 889,723
$ 1,198,380
$ 733,586
$ 3,492,357
Operations and maintenance 209,947
208,031
216,011
219,146
853,135
Operating income 61,333
162,704
301,238
86,709
611,984
Net income attributable to common shareholder 19,868
125,362
261,187
43,857
450,274
2014 Quarter Ended,
2014
March 31,
June 30,
September 30,
December 31,
Total
Operating revenues $ 685,545
$ 905,578
$ 1,172,190
$ 725,633
$ 3,488,946
Operations and maintenance 208,285
208,059
212,430
253,668
882,442
Operating income 69,635
180,394
287,928
54,835
592,792
Net income attributable to common shareholder 19,518
134,916
251,047
15,738
421,219
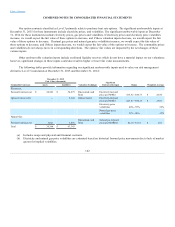
13. Fair Value Measurements
We classify our assets and liabilities that are carried at fair value within the fair value hierarchy. This hierarchy ranks the quality
and reliability of the inputs used to determine fair values, which are then classified and disclosed in one of three categories. The three
levels of the fair value hierarchy are:
Level 1 — Unadjusted quoted prices in active markets for identical assets or liabilities that we have the ability to access at the
measurement date. Active markets are those in which transactions for the asset or liability occur in sufficient frequency and volume to
provide information on an ongoing basis. This category includes exchange traded equities, exchange traded derivative instruments,
exchange traded mutual funds, cash equivalents, and investments in U.S. Treasury securities.
Level 2 — Utilizes quoted prices in active markets for similar assets or liabilities; quoted prices in markets that are not active;
and model-derived valuations whose inputs are observable (such as yield curves). This category includes non-exchange traded
contracts such as forwards, options, swaps and certain investments in fixed income securities. This category also includes certain
investments that are valued and redeemable based on NAV, such as common and collective trusts and commingled funds.
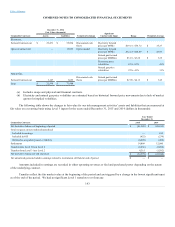
Level 3 — Valuation models with significant unobservable inputs that are supported by little or no market activity. Instruments
in this category include long-dated derivative transactions where valuations are unobservable due to the length of the transaction,
options, and transactions in locations where observable market data does not exist. The valuation models we employ utilize spot prices,
forward prices, historical market data and other factors to forecast future prices.
Assets and liabilities are classified in their entirety based on the lowest level of input that is significant to the fair value
measurement. Thus, a valuation may be classified in Level 3 even though the valuation may include significant inputs that are readily
observable. We maximize the use of observable inputs and minimize the use of unobservable inputs. We rely primarily on the market
approach of using prices and other market
137