APS 2015 Annual Report Download - page 94
Download and view the complete annual report
Please find page 94 of the 2015 APS annual report below. You can navigate through the pages in the report by either clicking on the pages listed below, or by using the keyword search tool below to find specific information within the annual report.-
 1
1 -
2
-
3
-
4
-
5
-
6
-
7
-
8
-
9
-
10
-
11
-
12
-
13
-
14
-
15
-
16
-
17
-
18
-
19
-
20
-
21
-
22
-
23
-
24
-
25
-
26
-
27
-
28
-
29
-
30
-
31
-
32
-
33
-
34
-
35
-
36
-
37
-
38
-
39
-
40
-
41
-
42
-
43
-
44
-
45
-
46
-
47
-
48
-
49
-
50
-
51
-
52
-
53
-
54
-
55
-
56
-
57
-
58
-
59
-
60
-
61
-
62
-
63
-
64
-
65
-
66
-
67
-
68
-
69
-
70
-
71
-
72
-
73
-
74
-
75
-
76
-
77
-
78
-
79
-
80
-
81
-
82
-
83
-
 84
84 -
 85
85 -
 86
86 -
 87
87 -
 88
88 -
 89
89 -
 90
90 -
 91
91 -
 92
92 -
 93
93 -
 94
94 -
 95
95 -
 96
96 -
 97
97 -
 98
98 -
 99
99 -
 100
100 -
 101
101 -
 102
102 -
 103
103 -
 104
104 -
105
-
106
-
107
-
108
-
109
-
110
-
111
-
112
-
113
-
114
-
115
-
116
-
117
-
118
-
119
-
120
-
121
-
122
-
123
-
124
-
125
-
126
-
127
-
128
-
129
-
130
-
131
-
132
-
133
-
134
-
135
-
136
-
137
-
138
-
139
-
140
-
141
-
142
-
143
-
144
-
145
-
146
-
147
-
148
-
149
-
150
-
151
-
152
-
153
-
154
-
155
-
156
-
157
-
158
-
159
-
160
-
161
-
162
-
163
-
164
-
165
-
166
-
167
-
168
-
169
-
170
-
171
-
172
-
173
-
174
-
175
-
176
-
177
-
178
-
179
-
180
-
181
-
182
-
183
-
184
-
185
-
186
-
187
-
188
-
189
-
190
-
191
-
192
-
193
-
194
-
195
-
196
-
197
-
198
-
199
-
200
-
201
-
202
-
203
-
204
-
205
-
206
-
207
-
208
-
209
-
210
-
211
-
212
-
213
-
214
-
215
-
216
-
217
-
218
-
219
-
220
-
221
-
222
-
223
-
224
-
225
-
226
-
227
-
228
-
229
-
230
-
231
-
232
-
233
-
234
-
235
-
236
-
237
-
238
-
239
-
240
-
241
-
242
-
243
-
244
-
245
-
246
-
247
-
248
-
249
-
250
-
251
-
252
-
253
-
254
-
255
-
256
-
257
-
258
-
259
-
260
-
261
-
262
-
263
-
264
 |
 |

Table of Contents
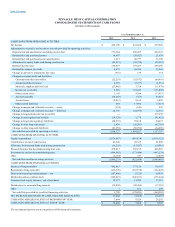
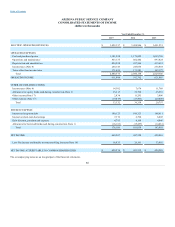
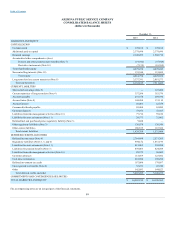
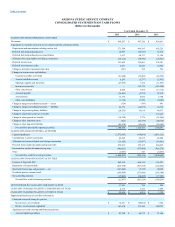
ARIZONA PUBLIC SERVICE COMPANY
CONSOLIDATED STATEMENTS OF CASH FLOWS
(dollars in thousands)
Year Ended December 31,
2015
2014
2013
CASH FLOWS FROM OPERATING ACTIVITIES
Net income $ 469,207
$ 447,320
$ 458,861
Adjustments to reconcile net income to net cash provided by operating activities:
Depreciation and amortization including nuclear fuel 571,540
496,393
492,226
Deferred fuel and purchased power 14,997
(26,927)
21,678
Deferred fuel and purchased power amortization 1,617
40,757
31,190
Allowance for equity funds used during construction (35,215)
(30,790)
(25,581)
Deferred income taxes 223,069
155,401
278,101
Deferred investment tax credit 8,473
26,246
52,542
Change in derivative instruments fair value (381)
339
534
Changes in current assets and liabilities:
Customer and other receivables (21,040)
(52,466)
(46,552)
Accrued unbilled revenues 4,293
(3,737)
(1,951)
Materials, supplies and fossil fuel (23,945)
3,724
(11,878)
Income tax receivable —
135,179
(134,590)
Other current assets 4,498
3,766
(17,112)
Accounts payable (34,891)
(2,355)
47,870
Accrued taxes 13,378
8,650
5,760
Other current liabilities (3,718)
33,970
(9,005)
Change in margin and collateral accounts — assets (324)
(343)
993
Change in margin and collateral accounts — liabilities 22,776
(24,975)
12,355
Change in long-term regulatory liabilities (20,535)
59,618
64,473
Change in long-term income tax receivable —
—
137,665
Change in unrecognized tax benefits (10,328)
2,778
(91,244)
Change in other long-term assets (813)
(62,739)
(46,675)
Change in other long-term liabilities (82,628)
(85,642)
(24,969)
Net cash flow provided by operating activities 1,100,030
1,124,167
1,194,691
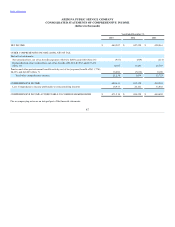
CASH FLOWS FROM INVESTING ACTIVITIES
Capital expenditures (1,072,053)
(910,084)
(1,016,322)
Contributions in aid of construction 46,546
20,325
41,090
Allowance for borrowed funds used during construction (16,183)
(15,457)
(14,861)
Proceeds from nuclear decommissioning trust sales 478,813
356,195
446,025
Investment in nuclear decommissioning trust (496,062)
(373,444)
(463,274)
Other (1,093)
347
(2,067)
Net cash flow used for investing activities (1,060,032)
(922,118)
(1,009,409)
CASH FLOWS FROM FINANCING ACTIVITIES
Issuance of long-term debt 842,415
606,126
136,307
Repayment of long-term debt (415,570)
(527,578)
(122,828)
Short-term borrowings and payments — net (147,400)
(5,725)
60,950
Dividends paid on common stock (266,900)
(253,600)
(242,100)
Noncontrolling interests (35,002)
(20,482)
(17,385)
Net cash flow used for financing activities (22,457)
(201,259)
(185,056)
NET INCREASE IN CASH AND CASH EQUIVALENTS 17,541
790
226
CASH AND CASH EQUIVALENTS AT BEGINNING OF YEAR 4,515
3,725
3,499
CASH AND CASH EQUIVALENTS AT END OF YEAR $ 22,056
$ 4,515
$ 3,725
Supplemental disclosure of cash flow information:
Cash paid (received) during the year for:
Income taxes, net of refunds $ 14,831
$ (86,054)
$ 7,524
Interest, net of amounts capitalized 167,670
173,436
180,757
Significant non-cash investing and financing activities:
Accrued capital expenditures $ 83,798
$ 44,712
$ 33,184