APS 2015 Annual Report Download - page 128
Download and view the complete annual report
Please find page 128 of the 2015 APS annual report below. You can navigate through the pages in the report by either clicking on the pages listed below, or by using the keyword search tool below to find specific information within the annual report.-
 1
1 -
2
-
3
-
4
-
5
-
6
-
7
-
8
-
9
-
10
-
11
-
12
-
13
-
14
-
15
-
16
-
17
-
18
-
19
-
20
-
21
-
22
-
23
-
24
-
25
-
26
-
27
-
28
-
29
-
30
-
31
-
32
-
33
-
34
-
35
-
36
-
37
-
38
-
39
-
40
-
41
-
42
-
43
-
44
-
45
-
46
-
47
-
48
-
49
-
50
-
51
-
52
-
53
-
54
-
55
-
56
-
57
-
58
-
59
-
60
-
61
-
62
-
63
-
64
-
65
-
66
-
67
-
68
-
69
-
70
-
71
-
72
-
73
-
74
-
75
-
76
-
77
-
78
-
79
-
80
-
81
-
82
-
83
-
84
-
85
-
86
-
87
-
88
-
89
-
90
-
91
-
92
-
93
-
94
-
95
-
96
-
97
-
98
-
99
-
100
-
101
-
102
-
103
-
104
-
105
-
106
-
107
-
108
-
109
-
110
-
111
-
112
-
113
-
114
-
115
-
116
-
117
-
 118
118 -
 119
119 -
 120
120 -
 121
121 -
 122
122 -
 123
123 -
 124
124 -
 125
125 -
 126
126 -
 127
127 -
 128
128 -
 129
129 -
 130
130 -
 131
131 -
 132
132 -
 133
133 -
 134
134 -
 135
135 -
 136
136 -
 137
137 -
 138
138 -
139
-
140
-
141
-
142
-
143
-
144
-
145
-
146
-
147
-
148
-
149
-
150
-
151
-
152
-
153
-
154
-
155
-
156
-
157
-
158
-
159
-
160
-
161
-
162
-
163
-
164
-
165
-
166
-
167
-
168
-
169
-
170
-
171
-
172
-
173
-
174
-
175
-
176
-
177
-
178
-
179
-
180
-
181
-
182
-
183
-
184
-
185
-
186
-
187
-
188
-
189
-
190
-
191
-
192
-
193
-
194
-
195
-
196
-
197
-
198
-
199
-
200
-
201
-
202
-
203
-
204
-
205
-
206
-
207
-
208
-
209
-
210
-
211
-
212
-
213
-
214
-
215
-
216
-
217
-
218
-
219
-
220
-
221
-
222
-
223
-
224
-
225
-
226
-
227
-
228
-
229
-
230
-
231
-
232
-
233
-
234
-
235
-
236
-
237
-
238
-
239
-
240
-
241
-
242
-
243
-
244
-
245
-
246
-
247
-
248
-
249
-
250
-
251
-
252
-
253
-
254
-
255
-
256
-
257
-
258
-
259
-
260
-
261
-
262
-
263
-
264
 |
 |

Table of Contents
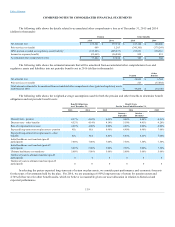
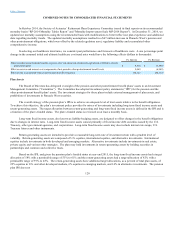
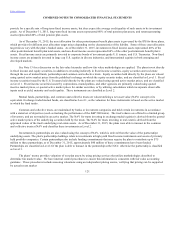
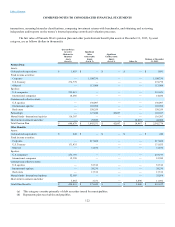
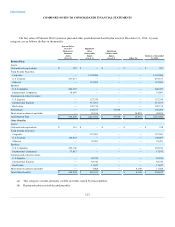
COMBINED NOTES TO CONSOLIDATED FINANCIAL STATEMENTS
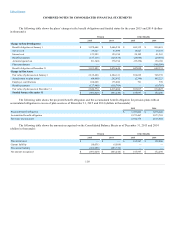
The fair value of Pinnacle West’s pension plan and other postretirement benefit plan assets at December 31, 2014, by asset
category, are as follows (dollars in thousands):
Quoted Prices
in Active
Markets for
Identical
Assets
(Level 1)
Significant
Other
Observable
Inputs
(Level 2)
Significant
Unobservable
Inputs
(Level 3)
Other (b)
Balance at December
31, 2014
Pension Plan:
Assets:
Cash and cash equivalents $ 387
$ —
$ —
$ —
$ 387
Fixed Income Securities:
Corporate —
1,162,096
—
—
1,162,096
U.S. Treasury 291,817
—
—
—
291,817
Other (a) —
113,265
—
—
113,265
Equities:
U.S. Companies 246,387
—
—
—
246,387
International Companies 18,069
—
—
—
18,069
Common and collective trusts:
U.S. Equities —
127,336
—
—
127,336
International Equities —
317,167
—
—
317,167
Real estate —
129,715
—
—
129,715
Partnerships —
138,337
27,929
—
166,266
Short-term investments and other —
26,016
—
16,883
42,899
Total Pension Plan $ 556,660
$ 2,013,932
$ 27,929
$ 16,883
$ 2,615,404
Other Benefits:
Assets:
Cash and cash equivalents $ 318
$ —
$ —
$ —
$ 318
Fixed Income Securities:
Corporate —
187,961
—
—
187,961
U.S. Treasury 130,967
—
—
—
130,967
Other (a) —
35,291
—
—
35,291
Equities:
U.S. Companies 265,106
—
—
—
265,106
International Companies 17,813
—
—
—
17,813
Common and collective trusts:
U.S. Equities —
88,258
—
—
88,258
International Equities —
85,746
—
—
85,746
Real Estate —
11,657
—
—
11,657
Short-term investments and other —
7,408
—
4,100
11,508
Total Other Benefits $ 414,204
$ 416,321
$ —
$ 4,100
$ 834,625
(a) This category consists primarily of debt securities issued by municipalities.
(b) Represents plan receivables and payables.
123