APS 2015 Annual Report Download - page 156
Download and view the complete annual report
Please find page 156 of the 2015 APS annual report below. You can navigate through the pages in the report by either clicking on the pages listed below, or by using the keyword search tool below to find specific information within the annual report.-
 1
1 -
2
-
3
-
4
-
5
-
6
-
7
-
8
-
9
-
10
-
11
-
12
-
13
-
14
-
15
-
16
-
17
-
18
-
19
-
20
-
21
-
22
-
23
-
24
-
25
-
26
-
27
-
28
-
29
-
30
-
31
-
32
-
33
-
34
-
35
-
36
-
37
-
38
-
39
-
40
-
41
-
42
-
43
-
44
-
45
-
46
-
47
-
48
-
49
-
50
-
51
-
52
-
53
-
54
-
55
-
56
-
57
-
58
-
59
-
60
-
61
-
62
-
63
-
64
-
65
-
66
-
67
-
68
-
69
-
70
-
71
-
72
-
73
-
74
-
75
-
76
-
77
-
78
-
79
-
80
-
81
-
82
-
83
-
84
-
85
-
86
-
87
-
88
-
89
-
90
-
91
-
92
-
93
-
94
-
95
-
96
-
97
-
98
-
99
-
100
-
101
-
102
-
103
-
104
-
105
-
106
-
107
-
108
-
109
-
110
-
111
-
112
-
113
-
114
-
115
-
116
-
117
-
118
-
119
-
120
-
121
-
122
-
123
-
124
-
125
-
126
-
127
-
128
-
129
-
130
-
131
-
132
-
133
-
134
-
135
-
136
-
137
-
138
-
139
-
140
-
141
-
142
-
143
-
144
-
145
-
 146
146 -
 147
147 -
 148
148 -
 149
149 -
 150
150 -
 151
151 -
 152
152 -
 153
153 -
 154
154 -
 155
155 -
 156
156 -
 157
157 -
 158
158 -
 159
159 -
 160
160 -
 161
161 -
 162
162 -
 163
163 -
 164
164 -
 165
165 -
 166
166 -
167
-
168
-
169
-
170
-
171
-
172
-
173
-
174
-
175
-
176
-
177
-
178
-
179
-
180
-
181
-
182
-
183
-
184
-
185
-
186
-
187
-
188
-
189
-
190
-
191
-
192
-
193
-
194
-
195
-
196
-
197
-
198
-
199
-
200
-
201
-
202
-
203
-
204
-
205
-
206
-
207
-
208
-
209
-
210
-
211
-
212
-
213
-
214
-
215
-
216
-
217
-
218
-
219
-
220
-
221
-
222
-
223
-
224
-
225
-
226
-
227
-
228
-
229
-
230
-
231
-
232
-
233
-
234
-
235
-
236
-
237
-
238
-
239
-
240
-
241
-
242
-
243
-
244
-
245
-
246
-
247
-
248
-
249
-
250
-
251
-
252
-
253
-
254
-
255
-
256
-
257
-
258
-
259
-
260
-
261
-
262
-
263
-
264
 |
 |

Table of Contents
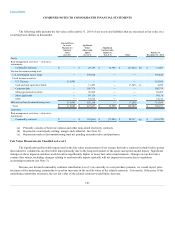
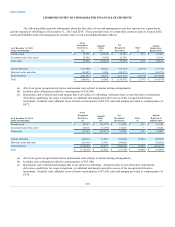
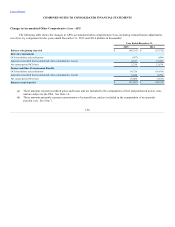
COMBINED NOTES TO CONSOLIDATED FINANCIAL STATEMENTS
Credit Risk and Credit Related Contingent Features
We are exposed to losses in the event of nonperformance or nonpayment by counterparties. We have risk management
contracts with many counterparties, including one counterparty for which our exposure represents approximately 87% of
Pinnacle West’s $28 million of risk management assets as of December 31, 2015. This exposure relates to a long-term traditional
wholesale contract with a counterparty that has a high credit quality. Our risk management process assesses and monitors the financial
exposure of all counterparties. Despite the fact that the great majority of trading counterparties’ debt is rated as investment grade by the
credit rating agencies, there is still a possibility that one or more of these companies could default, resulting in a material impact on
consolidated earnings for a given period. Counterparties in the portfolio consist principally of financial institutions, major energy
companies, municipalities and local distribution companies. We maintain credit policies that we believe minimize overall credit risk to
within acceptable limits. Determination of the credit quality of our counterparties is based upon a number of factors, including credit
ratings and our evaluation of their financial condition. To manage credit risk, we employ collateral requirements and standardized
agreements that allow for the netting of positive and negative exposures associated with a single counterparty. Valuation adjustments
are established representing our estimated credit losses on our overall exposure to counterparties.
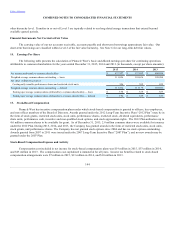
Certain of our derivative instrument contracts contain credit-risk-related contingent features including, among other things,
investment grade credit rating provisions, credit-related cross-default provisions, and adequate assurance provisions. Adequate
assurance provisions allow a counterparty with reasonable grounds for uncertainty to demand additional collateral based on subjective
events and/or conditions. For those derivative instruments in a net liability position, with investment grade credit contingencies, the
counterparties could demand additional collateral if our debt credit rating were to fall below investment grade (below BBB- for
Standard & Poor’s or Fitch or Baa3 for Moody’s).
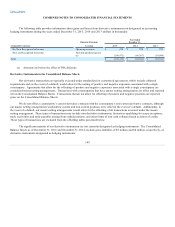
The following table provides information about our derivative instruments that have credit-risk-related contingent features at
December 31, 2015 (dollars in thousands):
December 31, 2015
Aggregate fair value of derivative instruments in a net liability position $ 207,387
Cash collateral posted 18,060
Additional cash collateral in the event credit-risk related contingent features were fully triggered (a) 112,301
(a) This amount is after counterparty netting and includes those contracts which qualify for scope exceptions, which are
excluded from the derivative details above.
We also have energy related non-derivative instrument contracts with investment grade credit-related contingent features, which
could also require us to post additional collateral of approximately $161 million if our debt credit ratings were to fall below investment
grade.
151