APS 2015 Annual Report Download - page 115
Download and view the complete annual report
Please find page 115 of the 2015 APS annual report below. You can navigate through the pages in the report by either clicking on the pages listed below, or by using the keyword search tool below to find specific information within the annual report.-
 1
1 -
2
-
3
-
4
-
5
-
6
-
7
-
8
-
9
-
10
-
11
-
12
-
13
-
14
-
15
-
16
-
17
-
18
-
19
-
20
-
21
-
22
-
23
-
24
-
25
-
26
-
27
-
28
-
29
-
30
-
31
-
32
-
33
-
34
-
35
-
36
-
37
-
38
-
39
-
40
-
41
-
42
-
43
-
44
-
45
-
46
-
47
-
48
-
49
-
50
-
51
-
52
-
53
-
54
-
55
-
56
-
57
-
58
-
59
-
60
-
61
-
62
-
63
-
64
-
65
-
66
-
67
-
68
-
69
-
70
-
71
-
72
-
73
-
74
-
75
-
76
-
77
-
78
-
79
-
80
-
81
-
82
-
83
-
84
-
85
-
86
-
87
-
88
-
89
-
90
-
91
-
92
-
93
-
94
-
95
-
96
-
97
-
98
-
99
-
100
-
101
-
102
-
103
-
104
-
 105
105 -
 106
106 -
 107
107 -
 108
108 -
 109
109 -
 110
110 -
 111
111 -
 112
112 -
 113
113 -
 114
114 -
 115
115 -
 116
116 -
 117
117 -
 118
118 -
 119
119 -
 120
120 -
 121
121 -
 122
122 -
 123
123 -
 124
124 -
 125
125 -
126
-
127
-
128
-
129
-
130
-
131
-
132
-
133
-
134
-
135
-
136
-
137
-
138
-
139
-
140
-
141
-
142
-
143
-
144
-
145
-
146
-
147
-
148
-
149
-
150
-
151
-
152
-
153
-
154
-
155
-
156
-
157
-
158
-
159
-
160
-
161
-
162
-
163
-
164
-
165
-
166
-
167
-
168
-
169
-
170
-
171
-
172
-
173
-
174
-
175
-
176
-
177
-
178
-
179
-
180
-
181
-
182
-
183
-
184
-
185
-
186
-
187
-
188
-
189
-
190
-
191
-
192
-
193
-
194
-
195
-
196
-
197
-
198
-
199
-
200
-
201
-
202
-
203
-
204
-
205
-
206
-
207
-
208
-
209
-
210
-
211
-
212
-
213
-
214
-
215
-
216
-
217
-
218
-
219
-
220
-
221
-
222
-
223
-
224
-
225
-
226
-
227
-
228
-
229
-
230
-
231
-
232
-
233
-
234
-
235
-
236
-
237
-
238
-
239
-
240
-
241
-
242
-
243
-
244
-
245
-
246
-
247
-
248
-
249
-
250
-
251
-
252
-
253
-
254
-
255
-
256
-
257
-
258
-
259
-
260
-
261
-
262
-
263
-
264
 |
 |

Table of Contents
COMBINED NOTES TO CONSOLIDATED FINANCIAL STATEMENTS
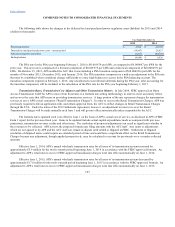
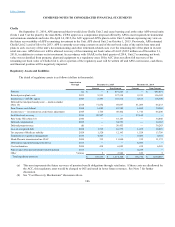
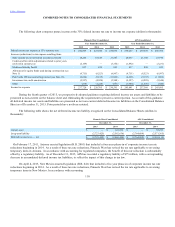
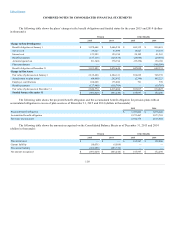
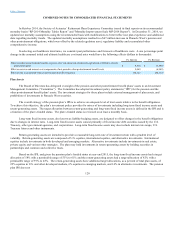
The following chart compares pretax income at the 35% federal income tax rate to income tax expense (dollars in thousands):
Pinnacle West Consolidated
APS Consolidated
Year Ended December 31,
Year Ended December 31,
2015
2014
2013
2015
2014
2013
Federal income tax expense at 35% statutory rate $ 242,869
$ 225,540
$ 234,695
$ 250,267
$ 239,638
$ 246,384
Increases (reductions) in tax expense resulting from:
State income tax net of federal income tax benefit 18,265
18,149
21,387
20,433
21,148
23,970
Credits and favorable adjustments related to prior years
resolved in current year (2,169)
—
(3,356)
(1,892)
—
(3,231)
Medicare Subsidy Part-D 837
830
823
837
830
823
Allowance for equity funds used during construction (see
Note 1) (9,711)
(8,523)
(6,997)
(9,711)
(8,523)
(6,997)
Palo Verde VIE noncontrolling interest (see Note 18) (6,626)
(9,135)
(11,862)
(6,626)
(9,135)
(11,862)
Investment tax credit amortization (5,527)
(4,928)
(3,548)
(5,527)
(4,928)
(3,548)
Other (218)
(1,228)
(551)
(1,940)
(1,670)
(444)
Income tax expense $ 237,720
$ 220,705
$ 230,591
$ 245,841
$ 237,360
$ 245,095
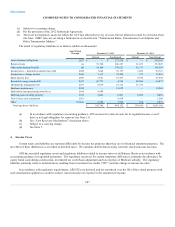
During the fourth quarter of 2015, we prospectively adopted guidance requiring deferred income tax assets and liabilities to be
presented as non-current on the balance sheet and eliminating the requirement to present a current portion. As a result of this guidance
all deferred income tax assets and liabilities are presented as net non-current deferred income tax liabilities on the Consolidated Balance
Sheet as of December 31, 2015. Prior periods have not been restated.
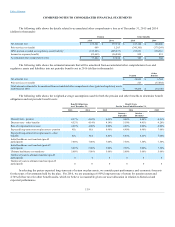
The following table shows the net deferred income tax liability recognized on the Consolidated Balance Sheets (dollars in
thousands):
Pinnacle West Consolidated
APS Consolidated
December 31,
December 31,
2015
2014
2015
2014
Current asset $ —
$ 122,232
$ —
$ 55,253
Long-term liability (2,723,425)
(2,582,636)
(2,764,489)
(2,571,365)
Deferred income taxes — net $ (2,723,425)
$ (2,460,404)
$ (2,764,489)
$ (2,516,112)
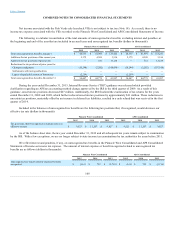
On February 17, 2011, Arizona enacted legislation (H.B. 2001) that included a four-year phase-in of corporate income tax rate
reductions beginning in 2014. As a result of these tax rate reductions, Pinnacle West has revised the tax rate applicable to reversing
temporary items in Arizona. In accordance with accounting for regulated companies, the benefit of this rate reduction is substantially
offset by a regulatory liability. As of December 31, 2015, APS has recorded a regulatory liability of $75 million, with a corresponding
decrease in accumulated deferred income tax liabilities, to reflect the impact of this change in tax law.
On April 4, 2013, New Mexico enacted legislation (H.B. 641) that included a five-year phase-in of corporate income tax rate
reductions beginning in 2014. As a result of these tax rate reductions, Pinnacle West has revised the tax rate applicable to reversing
temporary items in New Mexico. In accordance with accounting
110