APS 2015 Annual Report Download - page 71
Download and view the complete annual report
Please find page 71 of the 2015 APS annual report below. You can navigate through the pages in the report by either clicking on the pages listed below, or by using the keyword search tool below to find specific information within the annual report.-
 1
1 -
2
-
3
-
4
-
5
-
6
-
7
-
8
-
9
-
10
-
11
-
12
-
13
-
14
-
15
-
16
-
17
-
18
-
19
-
20
-
21
-
22
-
23
-
24
-
25
-
26
-
27
-
28
-
29
-
30
-
31
-
32
-
33
-
34
-
35
-
36
-
37
-
38
-
39
-
40
-
41
-
42
-
43
-
44
-
45
-
46
-
47
-
48
-
49
-
50
-
51
-
52
-
53
-
54
-
55
-
56
-
57
-
58
-
59
-
60
-
 61
61 -
 62
62 -
 63
63 -
 64
64 -
 65
65 -
 66
66 -
 67
67 -
 68
68 -
 69
69 -
 70
70 -
 71
71 -
 72
72 -
 73
73 -
 74
74 -
 75
75 -
 76
76 -
 77
77 -
 78
78 -
 79
79 -
 80
80 -
 81
81 -
82
-
83
-
84
-
85
-
86
-
87
-
88
-
89
-
90
-
91
-
92
-
93
-
94
-
95
-
96
-
97
-
98
-
99
-
100
-
101
-
102
-
103
-
104
-
105
-
106
-
107
-
108
-
109
-
110
-
111
-
112
-
113
-
114
-
115
-
116
-
117
-
118
-
119
-
120
-
121
-
122
-
123
-
124
-
125
-
126
-
127
-
128
-
129
-
130
-
131
-
132
-
133
-
134
-
135
-
136
-
137
-
138
-
139
-
140
-
141
-
142
-
143
-
144
-
145
-
146
-
147
-
148
-
149
-
150
-
151
-
152
-
153
-
154
-
155
-
156
-
157
-
158
-
159
-
160
-
161
-
162
-
163
-
164
-
165
-
166
-
167
-
168
-
169
-
170
-
171
-
172
-
173
-
174
-
175
-
176
-
177
-
178
-
179
-
180
-
181
-
182
-
183
-
184
-
185
-
186
-
187
-
188
-
189
-
190
-
191
-
192
-
193
-
194
-
195
-
196
-
197
-
198
-
199
-
200
-
201
-
202
-
203
-
204
-
205
-
206
-
207
-
208
-
209
-
210
-
211
-
212
-
213
-
214
-
215
-
216
-
217
-
218
-
219
-
220
-
221
-
222
-
223
-
224
-
225
-
226
-
227
-
228
-
229
-
230
-
231
-
232
-
233
-
234
-
235
-
236
-
237
-
238
-
239
-
240
-
241
-
242
-
243
-
244
-
245
-
246
-
247
-
248
-
249
-
250
-
251
-
252
-
253
-
254
-
255
-
256
-
257
-
258
-
259
-
260
-
261
-
262
-
263
-
264
 |
 |

Table of Contents
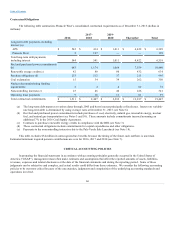
The following chart reflects the sensitivities that a change in certain actuarial assumptions would have had on the December 31,
2015 other postretirement benefit obligation and our 2015 reported other postretirement benefit expense, after consideration of amounts
capitalized or billed to electric plant participants, on Pinnacle West’s Consolidated Statements of Income (dollars in millions):
Increase (Decrease)
Actuarial Assumption (a)
Impact on Other
Postretirement
Benefit
Obligation
Impact on Other
Postretirement
Benefit Expense
Discount rate:
Increase 1%
$ (84)
$ (3)
Decrease 1%
107
6
Healthcare cost trend rate (b):
Increase 1%
100
9
Decrease 1%
(80)
(6)
Expected long-term rate of return on plan assets – pretax:
Increase 1%
—
(4)
Decrease 1%
—
4
(a) Each fluctuation assumes that the other assumptions of the calculation are held constant while the rates are changed by one
percentage point.
(b) This assumes a 1% change in the initial and ultimate healthcare cost trend rate.
See Note 7 for further details about our pension and other postretirement benefit plans.
Fair Value Measurements
We account for derivative instruments, investments held in our nuclear decommissioning trust fund, certain cash equivalents,
and plan assets held in our retirement and other benefit plans at fair value on a recurring basis. Fair value is the price that would be
received to sell an asset or paid to transfer a liability in an orderly transaction between market participants at the measurement date. We
use inputs, or assumptions that market participants would use, to determine fair market value. We utilize valuation techniques that
maximize the use of observable inputs and minimize the use of unobservable inputs. The significance of a particular input determines
how the instrument is classified in a fair value hierarchy. The determination of fair value sometimes requires subjective and complex
judgment. Our assessment of the inputs and the significance of a particular input to fair value measurement may affect the valuation of
the instruments and their placement within a fair value hierarchy. Actual results could differ from our estimates of fair value. See Note
1 for a discussion on accounting policies and Note 13 for fair value measurement disclosures.
OTHER ACCOUNTING MATTERS
During the fourth quarter of 2015, we early adopted two new accounting standards related to balance sheet presentation of debt
issuance costs, and balance sheet presentation of deferred income taxes. The adoption of these standards did not impact our results of
operations or cash flows.
During the first quarter of 2016, we will be adopting new consolidation accounting guidance. We do not expect the adoption of
this guidance to have a material impact on our financial statements.
68