Starbucks 2010 Annual Report Download - page 9
Download and view the complete annual report
Please find page 9 of the 2010 Starbucks annual report below. You can navigate through the pages in the report by either clicking on the pages listed below, or by using the keyword search tool below to find specific information within the annual report.-
 1
1 -
 2
2 -
 3
3 -
 4
4 -
 5
5 -
 6
6 -
 7
7 -
 8
8 -
 9
9 -
 10
10 -
 11
11 -
 12
12 -
 13
13 -
 14
14 -
 15
15 -
 16
16 -
 17
17 -
 18
18 -
 19
19 -
 20
20 -
21
-
22
-
23
-
24
-
25
-
26
-
27
-
28
-
29
-
30
-
31
-
32
-
33
-
34
-
35
-
36
-
37
-
38
-
39
-
40
-
41
-
42
-
43
-
44
-
45
-
46
-
47
-
48
-
49
-
50
-
51
-
52
-
53
-
54
-
55
-
56
-
57
-
58
-
59
-
60
-
61
-
62
-
63
-
64
-
65
-
66
-
67
-
68
-
69
-
70
-
71
-
72
-
73
-
74
-
75
-
76
-
77
-
78
-
79
-
80
-
81
-
82
-
83
-
84
-
85
-
86
-
87
-
88
-
89
-
90
 |
 |

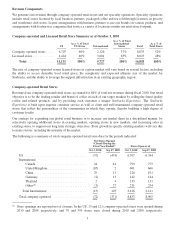
Revenue Components
We generate our revenues through company-operated retail stores and our specialty operations. Specialty operations
include retail stores licensed by local business partners, packaged coffee and tea sold through licensees in grocery
and warehouse club stores, license arrangements with business partners to use our brands on various products, and
arrangements with foodservice companies that service a variety of locations outside our retail store footprint.
Company-operated and Licensed Retail Store Summary as of October 3, 2010
US
As a % of Total
US Stores International
Asa%ofTotal
International
Stores Total
Asa%of
Total Stores
Company-operatedstores..... 6,707 60% 2,126 37% 8,833 52%
Licensedstores............. 4,424 40% 3,601 63% 8,025 48%
Total ................ 11,131 100% 5,727 100% 16,858 100%
The mix of company-operated versus licensed stores in a given market will vary based on several factors, including
the ability to access desirable local retail space, the complexity and expected ultimate size of the market for
Starbucks, and the ability to leverage the support infrastructure in an existing geographic region.
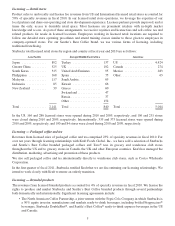
Company-operated Retail Stores
Revenue from company-operated retail stores accounted for 84% of total net revenues during fiscal 2010. Our retail
objective is to be the leading retailer and brand of coffee in each of our target markets by selling the finest quality
coffee and related products, and by providing each customer a unique Starbucks Experience.TheStarbucks
Experience is built upon superior customer service as well as clean and well-maintained company-operated retail
stores that reflect the personalities of the communities in which they operate, thereby building a high degree of
customer loyalty.
Our strategy for expanding our global retail business is to increase our market share in a disciplined manner, by
selectively opening additional stores in existing markets, opening stores in new markets, and increasing sales in
existing stores, to support our long term strategic objectives. Store growth in specific existing markets will vary due
to many factors, including the maturity of the market.
The following is a summary of total company-operated retail store data for the periods indicated:
Net Stores Opened
(Closed) During the
Fiscal Year Ended(1) Stores Open as of
Oct 3, 2010 Sep 27, 2009 Oct 3, 2010 Sep 27, 2009
US ..................................... (57) (474) 6,707 6,764
International:
Canada .............................. 24 44 799 775
United Kingdom ....................... (65) 2 601 666
China ............................... 29 13 220 191
Germany............................. (2) 13 142 144
Thailand ............................. 2 4 133 131
Other(2) .............................. (3) 27 231 234
TotalInternational ....................... (15) 103 2,126 2,141
Totalcompany-operated..................... (72) (371) 8,833 8,905
(1) Store openings are reported net of closures. In the US, 13 and 121 company-operated stores were opened during
2010 and 2009, respectively, and 70 and 595 stores were closed during 2010 and 2009, respectively.
3