Starbucks 2010 Annual Report Download - page 34
Download and view the complete annual report
Please find page 34 of the 2010 Starbucks annual report below. You can navigate through the pages in the report by either clicking on the pages listed below, or by using the keyword search tool below to find specific information within the annual report.-
 1
1 -
2
-
3
-
4
-
5
-
6
-
7
-
8
-
9
-
10
-
11
-
12
-
13
-
14
-
15
-
16
-
17
-
18
-
19
-
20
-
21
-
22
-
23
-
 24
24 -
 25
25 -
 26
26 -
 27
27 -
 28
28 -
 29
29 -
 30
30 -
 31
31 -
 32
32 -
 33
33 -
 34
34 -
 35
35 -
 36
36 -
 37
37 -
 38
38 -
 39
39 -
 40
40 -
 41
41 -
 42
42 -
 43
43 -
 44
44 -
45
-
46
-
47
-
48
-
49
-
50
-
51
-
52
-
53
-
54
-
55
-
56
-
57
-
58
-
59
-
60
-
61
-
62
-
63
-
64
-
65
-
66
-
67
-
68
-
69
-
70
-
71
-
72
-
73
-
74
-
75
-
76
-
77
-
78
-
79
-
80
-
81
-
82
-
83
-
84
-
85
-
86
-
87
-
88
-
89
-
90
 |
 |

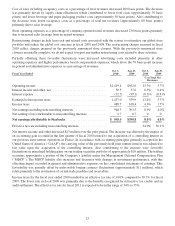
CPG net revenues increased primarily due to the launch of Starbucks VIA®Ready Brew (approximately $22
million) and the extra week in fiscal 2010 (approximately $16 million).
Operating margin decreased 480 basis points over the prior year due primarily to increased Starbucks VIA®Ready
Brew launch expenses.
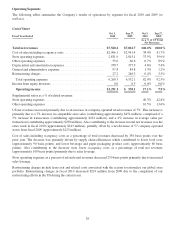
Other
Fiscal Year Ended
Oct 3,
2010
Sep 27,
2009
%
Change
Total specialty revenues ............................................ $ 150.8 $ 124.2 21.4%
Costofsales ...................................................... $ 89.4 $ 71.7 24.7%
Otheroperatingexpenses ............................................ 34.9 31.3 11.5%
Depreciationandamortizationexpenses ................................. 47.4 49.8 (4.8)%
Generalandadministrativeexpenses.................................... 334.1 254.4 31.3%
Restructuringcharges ............................................... 0.0 58.1 (100.0)%
Totaloperatingexpenses........................................... 505.8 465.3 8.7%
Lossfromequityinvestee ............................................ (3.3) 0.0 nm
Operating loss .................................................. $(358.3) $(341.1) 5.0%
Substantially all of net revenues in Other are generated from the Seattle’s Best Coffee operating segment. The
increase in revenues for Seattle’s Best Coffee was primarily due to sales to new national accounts (contributing
approximately $13 million).
Operating expenses included in Other relate to Seattle’s Best Coffee and Digital Ventures as well as expenses
pertaining to corporate administrative functions that support our operating segments but are not specifically
attributable to or managed by any segment and are not included in the reported financial results of the operating
segments. Total operating expenses increased $40.5 million primarily as a result of increased general and
administrative expenses ($80 million) primarily due to higher performance-based compensation in 2010. This
increase was partially offset by a decrease of $58 million in restructuring charges due to the completion of our
restructuring activities within the non-store support organization.
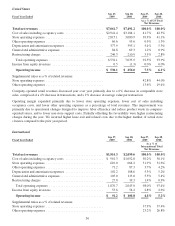
RESULTS OF OPERATIONS — FISCAL 2009 COMPARED TO FISCAL 2008
Consolidated results of operations (in millions):
Fiscal Year Ended
Sep 27,
2009
Sep 28,
2008
%
Change
Sep 27,
2009
Sep 28,
2008
%ofTotalNet
Revenues
Net revenues:
Company-operatedretail ....................... $8,180.1 $ 8,771.9 (6.7)% 83.7% 84.5%
Specialty:
Licensing ................................. 1,222.3 1,171.6 4.3% 12.5% 11.3%
Foodserviceandother ....................... 372.2 439.5 (15.3)% 3.8% 4.2%
Totalspecialty ............................... 1,594.5 1,611.1 (1.0)% 16.3% 15.5%
Total net revenues ............................. $9,774.6 $10,383.0 (5.9)% 100.0% 100.0%
Company-operated retail revenues decreased from fiscal 2008, primarily attributable to a 6% decline in comparable
store sales, comprised of a 4% decline in transactions and a 2% decline in the average value per transaction. Foreign
currency translation also contributed to the decline with the effects of a stronger US dollar relative to the British
pound and Canadian dollar. The weakness in consolidated comparable store sales was driven by the US segment,
with a comparable store sales decline of 6% for the year. The International segment experienced a 2% decline in
comparable store sales.
28