Starbucks 2010 Annual Report Download - page 32
Download and view the complete annual report
Please find page 32 of the 2010 Starbucks annual report below. You can navigate through the pages in the report by either clicking on the pages listed below, or by using the keyword search tool below to find specific information within the annual report.-
 1
1 -
2
-
3
-
4
-
5
-
6
-
7
-
8
-
9
-
10
-
11
-
12
-
13
-
14
-
15
-
16
-
17
-
18
-
19
-
20
-
21
-
 22
22 -
 23
23 -
 24
24 -
 25
25 -
 26
26 -
 27
27 -
 28
28 -
 29
29 -
 30
30 -
 31
31 -
 32
32 -
 33
33 -
 34
34 -
 35
35 -
 36
36 -
 37
37 -
 38
38 -
 39
39 -
 40
40 -
 41
41 -
 42
42 -
43
-
44
-
45
-
46
-
47
-
48
-
49
-
50
-
51
-
52
-
53
-
54
-
55
-
56
-
57
-
58
-
59
-
60
-
61
-
62
-
63
-
64
-
65
-
66
-
67
-
68
-
69
-
70
-
71
-
72
-
73
-
74
-
75
-
76
-
77
-
78
-
79
-
80
-
81
-
82
-
83
-
84
-
85
-
86
-
87
-
88
-
89
-
90
 |
 |

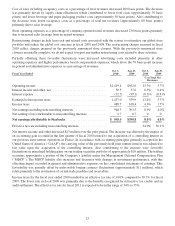
Operating Segments
The following tables summarize the Company’s results of operations by segment for fiscal 2010 and 2009 (in
millions).
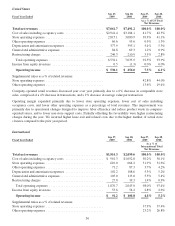
United States
Fiscal Year Ended
Oct 3,
2010
Sep 27,
2009
Oct 3,
2010
Sep 27,
2009
As a % of US Total
Net Revenues
Total net revenues ....................................... $7,560.4 $7,061.7 100.0% 100.0%
Costofsalesincludingoccupancycosts ........................ $2,906.1 $2,941.4 38.4% 41.7%
Storeoperatingexpenses ................................... 2,831.9 2,815.1 37.5% 39.9%
Otheroperatingexpenses ................................... 55.6 66.6 0.7% 0.9%
Depreciationandamortizationexpenses........................ 350.7 377.9 4.6% 5.4%
Generalandadministrativeexpenses .......................... 97.8 84.8 1.3% 1.2%
Restructuringcharges...................................... 27.2 246.3 0.4% 3.5%
Totaloperatingexpenses ................................. 6,269.3 6,532.1 82.9% 92.5%
Incomefromequityinvestees................................ 0.0 0.5 0.0% 0.0%
Operating income ...................................... $1,291.1 $ 530.1 17.1% 7.5%
Supplemental ratios as a % of related revenues:
Storeoperatingexpenses ................................... 40.3% 42.8%
Otheroperatingexpenses ................................... 10.5% 13.6%
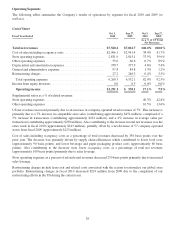
US net revenues increased primarily due to an increase in company-operated retail revenues of 7%. This increase is
primarily due to a 7% increase in comparable store sales (contributing approximately $452 million), comprised of a
3% increase in transactions (contributing approximately $222 million), and a 4% increase in average value per
transaction (contributing approximately $230 million). Also contributing to the increase in total net revenues was the
extra week in fiscal 2010 (approximately $143 million), partially offset by a net decrease of 57 company-operated
stores from fiscal 2009 (approximately $125 million).
Cost of sales including occupancy costs as a percentage of total revenues decreased by 330 basis points over the
prior year. The decrease was primarily driven by supply chain efficiencies which contributed to lower food costs
(approximately 90 basis points) and lower beverage and paper packaging product costs (approximately 60 basis
points). Also contributing to the decrease were lower occupancy costs as a percentage of total net revenues
(approximately 100 basis points) primarily due to sales leverage.
Store operating expenses as a percent of related retail revenues decreased 250 basis points primarily due to increased
sales leverage.
Restructuring charges include lease exit and related costs associated with the actions to rationalize our global store
portfolio. Restructuring charges in fiscal 2010 decreased $219 million from 2009 due to the completion of our
restructuring efforts in the US during the current year.
26