Starbucks 2010 Annual Report Download - page 35
Download and view the complete annual report
Please find page 35 of the 2010 Starbucks annual report below. You can navigate through the pages in the report by either clicking on the pages listed below, or by using the keyword search tool below to find specific information within the annual report.-
 1
1 -
2
-
3
-
4
-
5
-
6
-
7
-
8
-
9
-
10
-
11
-
12
-
13
-
14
-
15
-
16
-
17
-
18
-
19
-
20
-
21
-
22
-
23
-
24
-
 25
25 -
 26
26 -
 27
27 -
 28
28 -
 29
29 -
 30
30 -
 31
31 -
 32
32 -
 33
33 -
 34
34 -
 35
35 -
 36
36 -
 37
37 -
 38
38 -
 39
39 -
 40
40 -
 41
41 -
 42
42 -
 43
43 -
 44
44 -
 45
45 -
46
-
47
-
48
-
49
-
50
-
51
-
52
-
53
-
54
-
55
-
56
-
57
-
58
-
59
-
60
-
61
-
62
-
63
-
64
-
65
-
66
-
67
-
68
-
69
-
70
-
71
-
72
-
73
-
74
-
75
-
76
-
77
-
78
-
79
-
80
-
81
-
82
-
83
-
84
-
85
-
86
-
87
-
88
-
89
-
90
 |
 |

Fiscal Year Ended
Sep 27,
2009
Sep 28,
2008
Sep 27,
2009
Sep 28,
2008
%ofTotalNet
Revenues
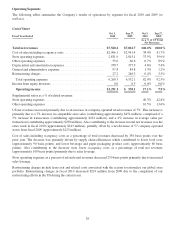
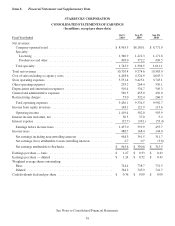
Costofsalesincludingoccupancycosts ....................... $4,324.9 $4,645.3 44.2% 44.7%
Storeoperatingexpenses ................................... 3,425.1 3,745.1 35.0% 36.1%
Otheroperatingexpenses................................... 264.4 330.1 2.7% 3.2%
Depreciationandamortizationexpenses ....................... 534.7 549.3 5.5% 5.3%
Generalandadministrativeexpenses .......................... 453.0 456.0 4.6% 4.4%
Restructuringcharges ..................................... 332.4 266.9 3.4% 2.6%
Totaloperatingexpenses ................................. 9,334.5 9,992.7 95.5% 96.2%
Incomefromequityinvestees ............................... 121.9 113.6 1.2% 1.1%
Operating income ..................................... $ 562.0 $ 503.9 5.7% 4.9%
Supplemental ratios as a % of related revenues:
Storeoperatingexpenses ................................... 41.9% 42.7%
Otheroperatingexpenses................................... 16.6% 20.5%
Cost of sales including occupancy costs decreased as a percentage of revenues primarily due to the implementation
of in-store operational efficiencies designed to reduce product waste, and due to lower dairy costs in the US,
partially offset by higher coffee costs.
Store operating expenses as a percentage of company-operated retail revenues decreased primarily due to reduced
headcount and spending in the regional support organization as a result of our restructuring efforts, and the effect of
initiatives to improve store labor efficiencies.
Restructuring charges include lease exit and related costs associated with the actions to rationalize our global store
portfolio and reduce the global cost structure.
Operating margin expansion was primarily due to the improved labor efficiency and reduced product waste in
company-operated stores, partially offset by increased restructuring charges.
Fiscal Year Ended
Sep 27,
2009
Sep 28,
2008
Sep 27,
2009
Sep 28,
2008
%ofTotalNet
Revenues
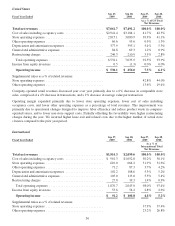
Operatingincome ........................................... $562.0 $503.9 5.7% 4.9%
Interestincomeandother,net .................................. 37.0 5.2 0.4% 0.1%
Interestexpense ............................................. (39.1) (53.4) (0.4)% (0.5)%
Earningsbeforeincometaxes .................................. 559.9 455.7 5.7% 4.4%
Incometaxes ............................................... 168.4 144.0 1.7% 1.4%
Net earnings including noncontrolling interests ..................... 391.5 311.7 4.0 3.0
Net earnings (loss) attributable to noncontrolling interests ............ 0.7 (3.8) 0 0
Net earnings attributable to Starbucks ......................... $390.8 $315.5 4.0% 3.0%
Effective tax rate including noncontrolling interests ................. 30.1% 31.6%
Net interest income and other increased due primarily to the impact of foreign currency fluctuations on certain
balance sheet amounts. Also contributing to the increase were lower unrealized market value losses on our trading
securities portfolio compared to fiscal 2008. Interest expense decreased due to a lower average balance of short term
borrowings and lower average short term borrowing rates in fiscal 2009 compared to the prior year. At the end of
fiscal 2009, we had no short term debt.
The relatively low 2009 effective tax rate was primarily due to a tax benefit recognized for retroactive tax credits
and an income tax credit related to the settlement of an employment tax audit in fiscal 2009. As a result of the audit
settlement, approximately $17 million of expense was recorded in store operating expenses, with an offsetting
income tax credit and no impact to net earnings.
29