Starbucks 2010 Annual Report Download - page 2
Download and view the complete annual report
Please find page 2 of the 2010 Starbucks annual report below. You can navigate through the pages in the report by either clicking on the pages listed below, or by using the keyword search tool below to find specific information within the annual report.-
 1
1 -
 2
2 -
 3
3 -
 4
4 -
 5
5 -
 6
6 -
 7
7 -
 8
8 -
 9
9 -
 10
10 -
 11
11 -
 12
12 -
 13
13 -
14
-
15
-
16
-
17
-
18
-
19
-
20
-
21
-
22
-
23
-
24
-
25
-
26
-
27
-
28
-
29
-
30
-
31
-
32
-
33
-
34
-
35
-
36
-
37
-
38
-
39
-
40
-
41
-
42
-
43
-
44
-
45
-
46
-
47
-
48
-
49
-
50
-
51
-
52
-
53
-
54
-
55
-
56
-
57
-
58
-
59
-
60
-
61
-
62
-
63
-
64
-
65
-
66
-
67
-
68
-
69
-
70
-
71
-
72
-
73
-
74
-
75
-
76
-
77
-
78
-
79
-
80
-
81
-
82
-
83
-
84
-
85
-
86
-
87
-
88
-
89
-
90
 |
 |

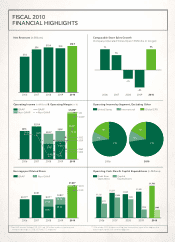
* Non-GAAP measure. Excludes $339, $332 and $53 million in pretax restructuring and
transformation charges in 2008, 2009 and 2010, respectively.
** 2006 includes $0.02 of expense resulting from the cumulative impact of the adoption of an
accounting change for asset retirement obligations.
Operating Income (in Millions) & Operating Margin (in %)
GAAP
Non-GAAP
GAAP
Non-GAAP
FISCAL 2010
FINANCIAL HIGHLIGHTS
2006 2007 2008 2009 2010 2006 2007 2008 2009 2010
2006 2007 2008 2009 2010 2006 2010
2006 2007 2008 2009 2010
$7.8
Net Revenues (in Billions)
$894
$0.71**
$0.87
$0.71* $0.80*
$1.28*
$1,054
Operating Income by Segment, Excluding Other
Comparable Store Sales Growth
(Company-Operated Stores Open 13 Months or Longer)
Earnings per Diluted Share
$9.4
5%
7% 7%
$10.4
$0.28
$0.28
$0.43
$0.52
–3%
$9.8
$10.7
–6%
$843*
$894*
Operating Cash Flow & Capital Expenditures (in Millions)
Cash from
Operations
Capital
Expenditures
GAAP Non-GAAP
United States International Global CPG
5.7%
13.3%
13.8%*
$1,419
$562
$504
$1,472*
$53
$332
$339
$0.04
$1.24
9.2%*
11.5%
4.9%
8.1%*
11.2%
2006 2007 2008 2009 2010
$1,132
$1,331 $1,259
$1,389
$1,705
$441
$985
$446
$771
$1,080
18% 15%
9% 12%
73% 73%