Starbucks 2010 Annual Report Download - page 48
Download and view the complete annual report
Please find page 48 of the 2010 Starbucks annual report below. You can navigate through the pages in the report by either clicking on the pages listed below, or by using the keyword search tool below to find specific information within the annual report.-
 1
1 -
2
-
3
-
4
-
5
-
6
-
7
-
8
-
9
-
10
-
11
-
12
-
13
-
14
-
15
-
16
-
17
-
18
-
19
-
20
-
21
-
22
-
23
-
24
-
25
-
26
-
27
-
28
-
29
-
30
-
31
-
32
-
33
-
34
-
35
-
36
-
37
-
 38
38 -
 39
39 -
 40
40 -
 41
41 -
 42
42 -
 43
43 -
 44
44 -
 45
45 -
 46
46 -
 47
47 -
 48
48 -
 49
49 -
 50
50 -
 51
51 -
 52
52 -
 53
53 -
 54
54 -
 55
55 -
 56
56 -
 57
57 -
 58
58 -
59
-
60
-
61
-
62
-
63
-
64
-
65
-
66
-
67
-
68
-
69
-
70
-
71
-
72
-
73
-
74
-
75
-
76
-
77
-
78
-
79
-
80
-
81
-
82
-
83
-
84
-
85
-
86
-
87
-
88
-
89
-
90
 |
 |

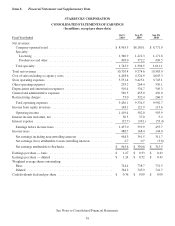
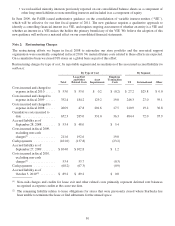
STARBUCKS CORPORATION
CONSOLIDATED STATEMENTS OF EQUITY
(In millions)
Common Stock Additional
Paid-in
Capital
Other
Additional
Paid-in
Capital
Retained
Earnings
Accumulated
Other
Comprehensive
Income/(Loss)
Shareholders’
Equity
Noncontrolling
Interest TotalShares Amount
Balance, September 30, 2007 ....................................... 738.3 $0.7 $ 0.0 $39.4 $2,189.4 $54.6 $2,284.1 $17.3 $2,301.4
Cumulative impact of adoption of accounting requirements for uncertain tax
positions .................................................... 0.0 0.0 (1.6) 0.0 (1.7) 0.0 (3.3) 0.0 (3.3)
Netearnings.................................................... 0.0 0.0 0.0 0.0 315.5 0.0 315.5 (3.8) 311.7
Unrealizedholdinggain,net ....................................... 0.0 0.0 0.0 0.0 0.0 0.8 0.8 0.0 0.8
Translationadjustment,netoftax ................................... 0.0 0.0 0.0 0.0 0.0 (7.0) (7.0) 0.0 (7.0)
Comprehensiveincome ........................................... 309.3 (3.8) 305.5
Stock-basedcompensationexpense.................................. 0.0 0.0 76.8 0.0 0.0 0.0 76.8 0.0 76.8
Exerciseofstockoptions,includingtaxbenefitof$8.4................... 6.6 0.0 77.4 0.0 0.0 0.0 77.4 0.0 77.4
Saleofcommonstock,includingtaxbenefitof$0.1 ..................... 2.8 0.0 41.9 0.0 0.0 0.0 41.9 0.0 41.9
Repurchaseofcommonstock ...................................... (12.2) 0.0 (194.5) 0.0 (100.8) 0.0 (295.3) 0.0 (295.3)
Netcontributionsfromnoncontrollinginterests......................... 0.0 0.0 0.0 0.0 0.0 0.0 0.0 4.8 4.8
Balance, September 28, 2008 ....................................... 735.5 $0.7 $ 0.0 $39.4 $2,402.4 $48.4 $2,490.9 $18.3 $2,509.2
Netearnings.................................................... 0.0 0.0 0.0 0.0 390.8 0.0 390.8 0.7 391.5
Unrealizedholdinggain,net ....................................... 0.0 0.0 0.0 0.0 0.0 1.8 1.8 0.0 1.8
Translationadjustment,netoftax ................................... 0.0 0.0 0.0 0.0 0.0 15.2 15.2 0.0 15.2
Comprehensiveincome ........................................... 407.8 0.7 408.5
Stock-basedcompensationexpense.................................. 0.0 0.0 84.3 0.0 0.0 0.0 84.3 0.0 84.3
Exerciseofstockoptions,includingtaxbenefitof$5.3................... 4.9 0.0 35.9 0.0 0.0 0.0 35.9 0.0 35.9
Saleofcommonstock,includingtaxbenefitof$0.1 ..................... 2.5 0.0 26.8 0.0 0.0 0.0 26.8 0.0 26.8
Net distributions to noncontrolling interests ........................... 0.0 0.0 0.0 0.0 0.0 0.0 0.0 (7.8) (7.8)
Balance, September 27, 2009 ....................................... 742.9 $0.7 $147.0 $39.4 $2,793.2 $65.4 $3,045.7 $11.2 $3,056.9
Netearnings.................................................... 0.0 0.0 0.0 0.0 945.6 0.0 945.6 2.7 948.3
Unrealizedholdingloss,net........................................ 0.0 0.0 0.0 0.0 0.0 (17.0) (17.0) 0.0 (17.0)
Translationadjustment,netoftax ................................... 0.0 0.0 0.0 0.0 0.0 8.8 8.8 0.0 8.8
Comprehensiveincome ........................................... 937.4 2.7 940.1
Stock-basedcompensationexpense.................................. 0.0 0.0 115.6 0.0 0.0 0.0 115.6 0.0 115.6
Exerciseofstockoptions,includingtaxbenefitof$27.7.................. 10.1 0.0 137.5 0.0 0.0 0.0 137.5 0.0 137.5
Saleofcommonstock,includingtaxbenefitof$0.1 ..................... 0.8 0.0 18.5 0.0 0.0 0.0 18.5 0.0 18.5
Repurchaseofcommonstock ...................................... (11.2) 0.0 (285.6) 0.0 0.0 0.0 (285.6) 0.0 (285.6)
Net distributions to noncontrolling interests ........................... 0.0 0.0 0.0 0.0 0.0 0.0 0.0 (0.8) (0.8)
Cashdividend .................................................. 0.0 0.0 0.0 0.0 (267.6) 0.0 (267.6) 0.0 (267.6)
Purchaseofnoncontrollinginterests ................................. 0.0 0.0 (26.8) 0.0 0.0 0.0 (26.8) (5.5) (32.3)
Balance, October 3, 2010 ........................................... 742.6 $0.7 $106.2 $39.4 $3,471.2 $57.2 $3,674.7 $ 7.6 $3,682.3
See Notes to Consolidated Financial Statements.
42