Starbucks 2010 Annual Report Download - page 63
Download and view the complete annual report
Please find page 63 of the 2010 Starbucks annual report below. You can navigate through the pages in the report by either clicking on the pages listed below, or by using the keyword search tool below to find specific information within the annual report.-
 1
1 -
2
-
3
-
4
-
5
-
6
-
7
-
8
-
9
-
10
-
11
-
12
-
13
-
14
-
15
-
16
-
17
-
18
-
19
-
20
-
21
-
22
-
23
-
24
-
25
-
26
-
27
-
28
-
29
-
30
-
31
-
32
-
33
-
34
-
35
-
36
-
37
-
38
-
39
-
40
-
41
-
42
-
43
-
44
-
45
-
46
-
47
-
48
-
49
-
50
-
51
-
52
-
 53
53 -
 54
54 -
 55
55 -
 56
56 -
 57
57 -
 58
58 -
 59
59 -
 60
60 -
 61
61 -
 62
62 -
 63
63 -
 64
64 -
 65
65 -
 66
66 -
 67
67 -
 68
68 -
 69
69 -
 70
70 -
 71
71 -
 72
72 -
 73
73 -
74
-
75
-
76
-
77
-
78
-
79
-
80
-
81
-
82
-
83
-
84
-
85
-
86
-
87
-
88
-
89
-
90
 |
 |

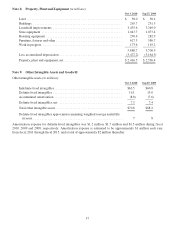
Note 8: Property, Plant and Equipment (in millions)
Oct 3, 2010 Sep 27, 2009
Land .......................................................... $ 58.0 $ 58.2
Buildings ...................................................... 265.7 231.5
Leasehold improvements .......................................... 3,435.6 3,349.0
Storeequipment ................................................. 1,047.7 1,073.4
Roastingequipment .............................................. 290.6 282.9
Furniture,fixturesandother ........................................ 617.5 586.7
Workinprogress ................................................ 173.6 119.2
5,888.7 5,700.9
Less accumulated depreciation ...................................... (3,472.2) (3,164.5)
Property,plantandequipment,net ................................... $2,416.5 $ 2,536.4
Note 9: Other Intangible Assets and Goodwill
Other intangible assets (in millions):
Oct 3, 2010 Sep 27, 2009
Indefinite-lived intangibles ......................................... $63.5 $60.8
Definite-lived intangibles .......................................... 16.1 15.0
Accumulatedamortization ......................................... (8.8) (7.6)
Definite-lived intangibles, net ...................................... 7.3 7.4
Total other intangible assets ........................................ $70.8 $68.2
Definite-lived intangibles approximate remaining weighted average useful life
inyears...................................................... 7 8
Amortization expense for definite-lived intangibles was $1.2 million, $1.7 million and $1.5 million during fiscal
2010, 2009 and 2008, respectively. Amortization expense is estimated to be approximately $1 million each year
from fiscal 2011 through fiscal 2015, and a total of approximately $2 million thereafter.
57