Starbucks 2010 Annual Report Download - page 31
Download and view the complete annual report
Please find page 31 of the 2010 Starbucks annual report below. You can navigate through the pages in the report by either clicking on the pages listed below, or by using the keyword search tool below to find specific information within the annual report.-
 1
1 -
2
-
3
-
4
-
5
-
6
-
7
-
8
-
9
-
10
-
11
-
12
-
13
-
14
-
15
-
16
-
17
-
18
-
19
-
20
-
 21
21 -
 22
22 -
 23
23 -
 24
24 -
 25
25 -
 26
26 -
 27
27 -
 28
28 -
 29
29 -
 30
30 -
 31
31 -
 32
32 -
 33
33 -
 34
34 -
 35
35 -
 36
36 -
 37
37 -
 38
38 -
 39
39 -
 40
40 -
 41
41 -
42
-
43
-
44
-
45
-
46
-
47
-
48
-
49
-
50
-
51
-
52
-
53
-
54
-
55
-
56
-
57
-
58
-
59
-
60
-
61
-
62
-
63
-
64
-
65
-
66
-
67
-
68
-
69
-
70
-
71
-
72
-
73
-
74
-
75
-
76
-
77
-
78
-
79
-
80
-
81
-
82
-
83
-
84
-
85
-
86
-
87
-
88
-
89
-
90
 |
 |

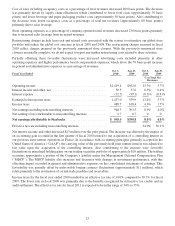
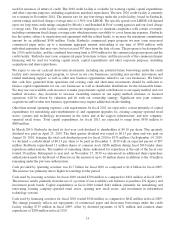
Cost of sales including occupancy costs as a percentage of total revenues decreased 260 basis points. The decrease
was primarily driven by supply chain efficiencies which contributed to lower food costs (approximately 70 basis
points) and lower beverage and paper packaging product costs (approximately 50 basis points). Also contributing to
the decrease were lower occupancy costs as a percentage of total net revenues (approximately 80 basis points)
primarily due to sales leverage.
Store operating expenses as a percentage of company-operated retail revenues decreased 230 basis points primarily
due to increased sales leverage from increased revenues.
Restructuring charges include lease exit and related costs associated with the actions to rationalize our global store
portfolio and reduce the global cost structure in fiscal 2009 and 2008. The restructuring charges incurred in fiscal
2010 reflect charges incurred on the previously announced store closures. With the previously-announced store
closures essentially complete, we do not expect to report any further restructuring costs related to these activities.
Partially offsetting these favorable fluctuations were increased advertising costs included primarily in other
operating expenses and higher performance based compensation expenses, which drove the 70 basis point increase
in general and administrative expenses as a percentage of revenues.
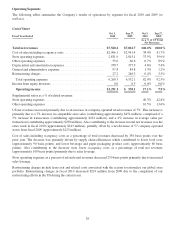
Fiscal Year Ended
Oct 3,
2010
Sep 27,
2009
Oct 3,
2010
Sep 27,
2009
%ofTotalNet
Revenues
Operatingincome........................................... $1,419.4 $562.0 13.3% 5.7%
Interestincomeandother,net.................................. 50.3 37.0 0.5% 0.4%
Interestexpense ............................................ (32.7) (39.1) (0.3)% (0.4)%
Earningsbeforeincometaxes.................................. 1,437.0 559.9 13.4% 5.7%
Incometaxes .............................................. 488.7 168.4 4.6% 1.7%
Net earnings including noncontrolling interests .................... 948.3 391.5 8.9% 4.0%
Net earnings (loss) attributable to noncontrolling interests ............ 2.7 0.7 0 0
Net earnings attributable to Starbucks ......................... $ 945.6 $390.8 8.8% 4.0%
Effective tax rate including noncontrolling interests ................. 34.0% 30.1%
Net interest income and other increased $13 million over the prior period. The increase was driven by the impact of
an accounting gain recorded in the first quarter of fiscal 2010 related to our acquisition of a controlling interest in
our previous joint venture operations in France. In accordance with accounting principles generally accepted in the
United States of America (“GAAP”), the carrying value of the previously held joint venture interest was adjusted to
fair value upon the acquisition of the controlling interest. Also contributing to the increase were favorable
fluctuations in unrealized holding gains on our trading securities portfolio of approximately $10 million. The trading
securities approximate a portion of the Company’s liability under the Management Deferred Compensation Plan
(“MDCP”). The MDCP liability also increases and decreases with changes in investment performance, with this
offsetting impact recorded in general and administrative expenses on the consolidated statements of earnings. This
favorability was partially offset by unfavorable foreign currency fluctuations (approximately $11 million), which
relate primarily to the revaluation of certain trade payables and receivables.
Income taxes for the fiscal year ended 2010 resulted in an effective tax rate of 34.0% compared to 30.1% for fiscal
2009. The lower rate in fiscal 2009 was primarily due to the benefits recognized for retroactive tax credits and an
audit settlement. The effective tax rate for fiscal 2011 is expected to be in the range of 34% to 35%.
25