Starbucks 2010 Annual Report Download - page 36
Download and view the complete annual report
Please find page 36 of the 2010 Starbucks annual report below. You can navigate through the pages in the report by either clicking on the pages listed below, or by using the keyword search tool below to find specific information within the annual report.-
 1
1 -
2
-
3
-
4
-
5
-
6
-
7
-
8
-
9
-
10
-
11
-
12
-
13
-
14
-
15
-
16
-
17
-
18
-
19
-
20
-
21
-
22
-
23
-
24
-
25
-
 26
26 -
 27
27 -
 28
28 -
 29
29 -
 30
30 -
 31
31 -
 32
32 -
 33
33 -
 34
34 -
 35
35 -
 36
36 -
 37
37 -
 38
38 -
 39
39 -
 40
40 -
 41
41 -
 42
42 -
 43
43 -
 44
44 -
 45
45 -
 46
46 -
47
-
48
-
49
-
50
-
51
-
52
-
53
-
54
-
55
-
56
-
57
-
58
-
59
-
60
-
61
-
62
-
63
-
64
-
65
-
66
-
67
-
68
-
69
-
70
-
71
-
72
-
73
-
74
-
75
-
76
-
77
-
78
-
79
-
80
-
81
-
82
-
83
-
84
-
85
-
86
-
87
-
88
-
89
-
90
 |
 |

United States
Fiscal Year Ended
Sep 27,
2009
Sep 28,
2008
Sep 27,
2009
Sep 28,
2008
Asa%ofUSTotal
Net Revenues
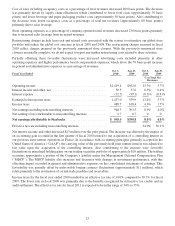
Total net revenues ....................................... $7,061.7 $7,491.2 100.0% 100.0%
Costofsalesincludingoccupancycosts ....................... $2,941.4 $3,184.1 41.7% 42.5%
Storeoperatingexpenses ................................... 2,815.1 3,080.9 39.9% 41.1%
Otheroperatingexpenses................................... 66.6 95.6 0.9% 1.3%
Depreciationandamortizationexpenses ....................... 377.9 395.1 5.4% 5.3%
Generalandadministrativeexpenses .......................... 84.8 69.3 1.2% 0.9%
Restructuringcharges ..................................... 246.3 210.9 3.5% 2.8%
Totaloperatingexpenses ................................. 6,532.1 7,035.9 92.5% 93.9%
Incomefromequityinvestees ............................... 0.5 (1.3) 0.0% 0.0%
Operating income ..................................... $ 530.1 $ 454.0 7.5% 6.1%
Supplemental ratios as a % of related revenues:
Storeoperatingexpenses ................................... 42.8% 44.0%
Otheroperatingexpenses................................... 13.6% 19.4%
Company-operated retail revenues decreased year over year primarily due to a 6% decrease in comparable store
sales, comprised of a 4% decrease in transactions, and a 2% decrease in average value per transaction.
Operating margin expanded primarily due to lower store operating expenses, lower cost of sales including
occupancy costs, and lower other operating expenses as a percentage of total revenues. This improvement was
primarily due to operational changes designed to improve labor efficiency and reduce product waste in company-
operated stores, and to lower non-store support costs. Partially offsetting the favorability were higher restructuring
charges during the year. We incurred higher lease exit and related costs due to the higher number of actual store
closures compared to the prior year period.
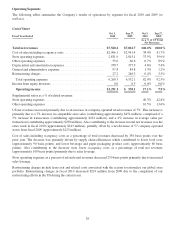
International
Fiscal Year Ended
Sep 27,
2009
Sep 28,
2008
Sep 27,
2009
Sep 28,
2008
As a % of
International Total
Net Revenues
Total net revenues ....................................... $1,914.3 $2,099.6 100.0% 100.0%
Costofsalesincludingoccupancycosts ....................... $ 961.3 $1,052.8 50.2% 50.1%
Storeoperatingexpenses ................................... 610.0 664.2 31.9% 31.6%
Otheroperatingexpenses................................... 71.2 87.3 3.7% 4.2%
Depreciationandamortizationexpenses ....................... 102.2 108.6 5.3% 5.2%
Generalandadministrativeexpenses .......................... 105.0 113.0 5.5% 5.4%
Restructuringcharges ..................................... 27.0 19.3 1.4% 0.9%
Totaloperatingexpenses ................................. 1,876.7 2,045.0 98.0% 97.4%
Incomefromequityinvestees ............................... 53.6 54.2 2.8% 2.6%
Operating income ..................................... $ 91.2 $ 108.8 4.8% 5.2%
Supplemental ratios as a % of related revenues:
Storeoperatingexpenses ................................... 37.9% 37.4%
Otheroperatingexpenses................................... 23.2% 26.8%
30