Starbucks 2010 Annual Report Download - page 30
Download and view the complete annual report
Please find page 30 of the 2010 Starbucks annual report below. You can navigate through the pages in the report by either clicking on the pages listed below, or by using the keyword search tool below to find specific information within the annual report.-
 1
1 -
2
-
3
-
4
-
5
-
6
-
7
-
8
-
9
-
10
-
11
-
12
-
13
-
14
-
15
-
16
-
17
-
18
-
19
-
 20
20 -
 21
21 -
 22
22 -
 23
23 -
 24
24 -
 25
25 -
 26
26 -
 27
27 -
 28
28 -
 29
29 -
 30
30 -
 31
31 -
 32
32 -
 33
33 -
 34
34 -
 35
35 -
 36
36 -
 37
37 -
 38
38 -
 39
39 -
 40
40 -
41
-
42
-
43
-
44
-
45
-
46
-
47
-
48
-
49
-
50
-
51
-
52
-
53
-
54
-
55
-
56
-
57
-
58
-
59
-
60
-
61
-
62
-
63
-
64
-
65
-
66
-
67
-
68
-
69
-
70
-
71
-
72
-
73
-
74
-
75
-
76
-
77
-
78
-
79
-
80
-
81
-
82
-
83
-
84
-
85
-
86
-
87
-
88
-
89
-
90
 |
 |

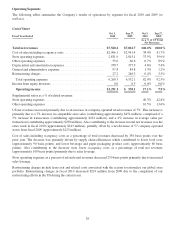
income from equity investees on the consolidated statements of earnings. The US foodservice business sells coffee
and other related products to institutional foodservice companies with the majority of its sales through national
broadline distribution networks. The CPG segment reflects relatively lower revenues, a modest cost structure, and a
resulting higher operating margin, compared to the other two reporting segments, which consist primarily of retail
stores.
Acquisitions
See Note 18 to the consolidated financial statements in this 10-K.
RESULTS OF OPERATIONS — FISCAL 2010 COMPARED TO FISCAL 2009
Consolidated results of operations (in millions):
Fiscal Year Ended
Oct 3,
2010
Sep 27,
2009
%
Change
Oct 3,
2010
Sep 27,
2009
%ofTotalNet
Revenues
Net revenues:
Company-operatedretail........................ $ 8,963.5 $8,180.1 9.6% 83.7% 83.7%
Specialty:
Licensing ................................. 1,340.9 1,222.3 9.7% 12.5% 12.5%
Foodserviceandother ........................ 403.0 372.2 8.3% 3.8% 3.8%
Totalspecialty................................ 1,743.9 1,594.5 9.4% 16.3% 16.3%
Total net revenues .............................. $10,707.4 $9,774.6 9.5% 100.0% 100.0%
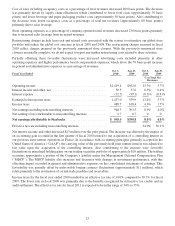
Consolidated net revenues were $10.7 billion for fiscal 2010, an increase of 9.5% over fiscal 2009. The increase was
primarily due to an increase in company-operated retail revenues driven by a 7% increase in global comparable
stores sales (contributing approximately $551 million). The increase in comparable store sales was due to a 4%
increase in number of transactions (contributing approximately $298 million) and a 3% increase in average value per
transaction (contributing approximately $253 million). Also contributing to the increase in revenues was the extra
week in fiscal 2010 (approximately $207 million), foreign currency translation resulting from the weakening of the
US dollar primarily in relation to the Canadian dollar (approximately $101 million), and the effect of consolidating
our previous joint venture in France (approximately $87 million). This increase was partially offset by a net decrease
of 72 company-operated stores from fiscal 2009 (approximately $119 million).
Fiscal Year Ended
Oct 3,
2010
Sep 27,
2009
Oct 3,
2010
Sep 27,
2009
%ofTotalNet
Revenues
Costofsalesincludingoccupancycosts ........................ $4,458.6 $4,324.9 41.6% 44.2%
Storeoperatingexpenses .................................... 3,551.4 3,425.1 33.2% 35.0%
Otheroperatingexpenses ................................... 293.2 264.4 2.7% 2.7%
Depreciationandamortizationexpenses ........................ 510.4 534.7 4.8% 5.5%
Generalandadministrativeexpenses........................... 569.5 453.0 5.3% 4.6%
Restructuringcharges ...................................... 53.0 332.4 0.5% 3.4%
Totaloperatingexpenses .................................. 9,436.1 9,334.5 88.1% 95.5%
Incomefromequityinvestees ................................ 148.1 121.9 1.4% 1.2%
Operating income ...................................... $1,419.4 $ 562.0 13.3% 5.7%
Supplemental ratios as a % of related revenues:
Storeoperatingexpenses .................................... 39.6% 41.9%
Otheroperatingexpenses ................................... 16.8% 16.6%
24