Starbucks 2010 Annual Report Download - page 69
Download and view the complete annual report
Please find page 69 of the 2010 Starbucks annual report below. You can navigate through the pages in the report by either clicking on the pages listed below, or by using the keyword search tool below to find specific information within the annual report.-
 1
1 -
2
-
3
-
4
-
5
-
6
-
7
-
8
-
9
-
10
-
11
-
12
-
13
-
14
-
15
-
16
-
17
-
18
-
19
-
20
-
21
-
22
-
23
-
24
-
25
-
26
-
27
-
28
-
29
-
30
-
31
-
32
-
33
-
34
-
35
-
36
-
37
-
38
-
39
-
40
-
41
-
42
-
43
-
44
-
45
-
46
-
47
-
48
-
49
-
50
-
51
-
52
-
53
-
54
-
55
-
56
-
57
-
58
-
 59
59 -
 60
60 -
 61
61 -
 62
62 -
 63
63 -
 64
64 -
 65
65 -
 66
66 -
 67
67 -
 68
68 -
 69
69 -
 70
70 -
 71
71 -
 72
72 -
 73
73 -
 74
74 -
 75
75 -
 76
76 -
 77
77 -
 78
78 -
 79
79 -
80
-
81
-
82
-
83
-
84
-
85
-
86
-
87
-
88
-
89
-
90
 |
 |

The BSM option valuation model was developed for use in estimating the fair value of traded options, which have
no vesting restrictions and are fully transferable. Our employee stock options have characteristics significantly
different from those of traded options, and changes in the subjective input assumptions can materially affect the fair
value estimate. Because our stock options do not trade on a secondary exchange, employees do not derive a benefit
from holding stock options unless there is an increase, above the grant price, in the market price of the our stock.
Such an increase in stock price would benefit all shareholders commensurately.
Stock option transactions from September 30, 2007, through October 3, 2010 (in millions, except per share and
contractual life amounts):
Shares
Subject to
Options
Weighted
Average
Exercise
Price
per Share
Weighted
Average
Remaining
Contractual
Life (Years)
Aggregate
Intrinsic
Value
Outstanding, September 30, 2007 ....................... 65.5 $20.97 6.2 $507.5
Granted ......................................... 15.4 22.11
Exercised........................................ (6.6) 10.71
Expired/forfeited .................................. (11.3) 28.49
Outstanding, September 28, 2008 ....................... 63.0 20.96 5.7 114.9
Granted ......................................... 30.9 8.97
Granted under option exchange program ................ 4.7 14.92
Exercised........................................ (7.2) 7.31
Expired/forfeited .................................. (13.5) 18.99
Cancelled under option exchange program .............. (14.3) 29.34
Outstanding, September 27, 2009 ....................... 63.6 14.75 6.7 442.4
Granted ......................................... 14.9 22.28
Exercised........................................ (9.6) 11.94
Expired/forfeited .................................. (8.2) 18.73
Outstanding, October 3, 2010 .......................... 60.7 16.52 6.6 611.3
Exercisable, October 3, 2010 ........................... 27.3 17.48 4.6 264.1
Vested and expected to vest, October 3, 2010 .............. 55.8 16.53 6.5 564.7
The aggregate intrinsic value in the table above is the amount by which the market value of the underlying stock
exceeded the exercise price of outstanding options, is before applicable income taxes and represents the amount
optionees would have realized if all in-the-money options had been exercised on the last business day of the period
indicated.
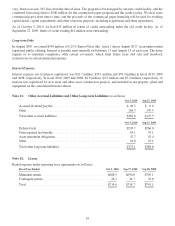
As of October 3, 2010, total unrecognized stock-based compensation expense, net of estimated forfeitures, related to
nonvested stock options was approximately $70 million, before income taxes, and is expected to be recognized over
a weighted average period of approximately 2.7 years. The total intrinsic value of stock options exercised was
$118 million, $44 million and $50 million during the three fiscal year period ended October 3, 2010. The total fair
value of options vested was $108 million, $75 million and $99 million during fiscal years 2010, 2009 and 2008,
respectively.
RSUs
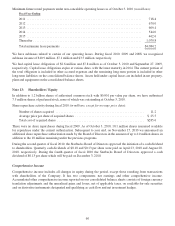
We have both time-vested and performance-based RSUs. Time-vested RSUs are awarded to eligible employees and
entitle the grantee to receive shares of common stock at the end of a vesting period, subject solely to the employee’s
continuing employment. Our performance-based RSUs are awarded to eligible employees and entitle the grantee to
receive shares of common stock if we achieve specified performance goals for the full fiscal year in the year of
award and the grantee remains employed during the subsequent vesting period. The fair value of RSUs is based on
the closing price of Starbucks common stock on the award date. Expense for performance-based RSUs is recognized
when it is probable the performance goal will be achieved.
63