Starbucks 2010 Annual Report Download - page 38
Download and view the complete annual report
Please find page 38 of the 2010 Starbucks annual report below. You can navigate through the pages in the report by either clicking on the pages listed below, or by using the keyword search tool below to find specific information within the annual report.-
 1
1 -
2
-
3
-
4
-
5
-
6
-
7
-
8
-
9
-
10
-
11
-
12
-
13
-
14
-
15
-
16
-
17
-
18
-
19
-
20
-
21
-
22
-
23
-
24
-
25
-
26
-
27
-
 28
28 -
 29
29 -
 30
30 -
 31
31 -
 32
32 -
 33
33 -
 34
34 -
 35
35 -
 36
36 -
 37
37 -
 38
38 -
 39
39 -
 40
40 -
 41
41 -
 42
42 -
 43
43 -
 44
44 -
 45
45 -
 46
46 -
 47
47 -
 48
48 -
49
-
50
-
51
-
52
-
53
-
54
-
55
-
56
-
57
-
58
-
59
-
60
-
61
-
62
-
63
-
64
-
65
-
66
-
67
-
68
-
69
-
70
-
71
-
72
-
73
-
74
-
75
-
76
-
77
-
78
-
79
-
80
-
81
-
82
-
83
-
84
-
85
-
86
-
87
-
88
-
89
-
90
 |
 |

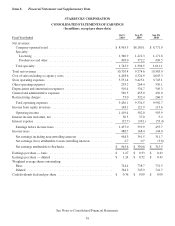
SUMMARIZED QUARTERLY FINANCIAL INFORMATION (unaudited, in millions, except EPS)
First Second Third Fourth Total
2010:
Netrevenues ............................... $2,722.7 $2,534.7 $2,612.0 $2,838.0 $10,707.4
Operating income(1) .......................... 352.6 339.8 327.7 399.3 1,419.4
Net earnings attributable to Starbucks(1) .......... 241.5 217.3 207.9 278.9 945.6
EPS—diluted.............................. 0.32 0.28 0.27 0.37 1.24
2009:
Netrevenues ............................... $2,615.2 $2,333.3 $2,403.9 $2,422.2 $ 9,774.6
Operating income(2) .......................... 117.7 40.9 204.0 199.4 562.0
Net earnings attributable to Starbucks(2) .......... 64.3 25.0 151.5 150.0 390.8
EPS—diluted.............................. 0.09 0.03 0.20 0.20 0.52
(1) Includes pretax restructuring charges of $18.3 million, $7.9 million, $20.4 million and $6.4 million for the first,
second, third and fourth fiscal quarters respectively.
(2) Includes pretax restructuring charges of $75.5 million, $152.1 million, $51.6 million and $53.2 million for the
first, second, third and fourth fiscal quarters respectively.
FINANCIAL CONDITION, LIQUIDITY AND CAPITAL RESOURCES
Starbucks cash and short-term investments were $1.4 billion and $666 million as of October 3, 2010 and
September 27, 2009, respectively. We actively manage our cash and short-term investments in order to internally
fund operating needs, make scheduled interest and principal payments on our borrowings, and return cash to
shareholders through common stock dividend payments and share repurchases. Our short-term investments
consisted predominantly of US Treasury and US Agency securities.
Our portfolio of long-term available for sale securities consists predominantly of high investment-grade corporate
bonds, diversified among industries and individual issuers. We also have investments in auction rate securities
(“ARS”), nearly all of which are classified as long-term. ARS totaling $41 million and $56 million were outstanding
as of October 3, 2010 and September 27, 2009, respectively. The reduction in ARS was due to $12 million in
redemptions during the fiscal year with all redemptions done at par. While the ongoing auction failures will limit the
liquidity of these ARS investments for some period of time, we do not believe the auction failures will materially
impact our ability to fund our working capital needs, capital expenditures, shareholder dividends or other business
requirements.
Starbucks $1 billion unsecured credit facility (the “2005 credit facility”) was available for working capital, capital
expenditures, and other corporate purposes. In November of 2010, subsequent to the end of the 2010 fiscal year, we
replaced the 2005 credit facility, which was scheduled to mature in August 2011. The new credit facility is described
in more detail below. The 2005 credit facility was paired with a commercial paper program whereby we could issue
unsecured commercial paper notes, up to a maximum amount outstanding at any time of $1 billion. The commercial
paper program was secured by the credit facility, and the combined borrowing limit was $1 billion for the
commercial paper program and the credit facility. During fiscal 2010 and 2009, there were no borrowings under the
2005 credit facility or commercial paper program. As of October 3, 2010, a total of $15 million in letters of credit
were outstanding under our revolving credit facility.
The 2005 credit facility contained provisions requiring us to maintain compliance with certain covenants, including
a minimum fixed charge coverage ratio. As of October 3, 2010 and September 27, 2009, we were in compliance
with each of these covenants. The $550 million of 10-year 6.25% Senior Notes also require us to maintain
compliance with certain covenants, including limits on future liens and sale and leaseback transactions on certain
material properties. As of October 3, 2010 and September 27, 2009, we were in compliance with each of these
covenants.
In November of 2010, subsequent to the end of the 2010 fiscal year, we replaced the 2005 credit facility with a
$500 million unsecured credit facility (the “2010 credit facility”) with various banks, of which $100 million may be
32