Starbucks 2010 Annual Report Download - page 37
Download and view the complete annual report
Please find page 37 of the 2010 Starbucks annual report below. You can navigate through the pages in the report by either clicking on the pages listed below, or by using the keyword search tool below to find specific information within the annual report.-
 1
1 -
2
-
3
-
4
-
5
-
6
-
7
-
8
-
9
-
10
-
11
-
12
-
13
-
14
-
15
-
16
-
17
-
18
-
19
-
20
-
21
-
22
-
23
-
24
-
25
-
26
-
 27
27 -
 28
28 -
 29
29 -
 30
30 -
 31
31 -
 32
32 -
 33
33 -
 34
34 -
 35
35 -
 36
36 -
 37
37 -
 38
38 -
 39
39 -
 40
40 -
 41
41 -
 42
42 -
 43
43 -
 44
44 -
 45
45 -
 46
46 -
 47
47 -
48
-
49
-
50
-
51
-
52
-
53
-
54
-
55
-
56
-
57
-
58
-
59
-
60
-
61
-
62
-
63
-
64
-
65
-
66
-
67
-
68
-
69
-
70
-
71
-
72
-
73
-
74
-
75
-
76
-
77
-
78
-
79
-
80
-
81
-
82
-
83
-
84
-
85
-
86
-
87
-
88
-
89
-
90
 |
 |

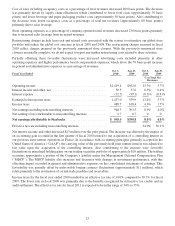
Company-operated retail revenues decreased primarily due to unfavorable foreign currency exchange rates,
particularly for the British pound and Canadian dollar. Partially offsetting the decrease were the net new store
openings during the fiscal year.
Specialty revenues decreased primarily due to continued softness in the hospitality industry and unfavorable foreign
currency exchange rates.
Operating margin decreased primarily due to higher restructuring charges and higher store operating expenses as a
percentage of total revenues. Restructuring charges of $27.0 million recognized during the year had a 50 basis point
impact on operating margin compared to the prior year, due to the previously announced store closures. Higher store
operating expenses as of percentage of company-operated retail revenues were driven by an increase in store
impairment charges and a decline in sales leverage impacting salaries and benefits. Partially offsetting the decrease
in operating margin were lower other operating expenses due to headcount reductions in the non-store support
functions.
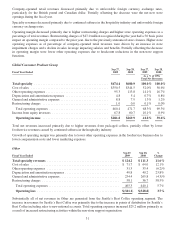
Global Consumer Products Group
Fiscal Year Ended
Sep 27,
2009
Sep 28,
2008
Sep 27,
2009
Sep 28,
2008
As a % of CPG
Total Net Revenues
Total specialty ............................................. $674.4 $680.9 100.0% 100.0%
Costofsales ............................................... $350.5 $344.5 52.0% 50.6%
Otheroperatingexpenses...................................... 95.3 113.8 14.1% 16.7%
Depreciationandamortizationexpenses .......................... 4.8 5.4 0.7% 0.8%
Generalandadministrativeexpenses ............................. 8.8 7.9 1.3% 1.2%
Restructuringcharges ........................................ 1.0 0.0 0.1% 0.0%
Totaloperatingexpenses .................................... 460.4 471.7 68.3% 69.3%
Incomefromequityinvestees .................................. 67.8 60.7 10.1% 8.9%
Operating income ........................................ $281.8 $269.9 41.8% 39.6%
Total net revenues increased primarily due to higher revenues from packaged coffees, partially offset by lower
foodservice revenues caused by continued softness in the hospitality industry.
Growth of operating margin was primarily due to lower other operating expenses in the foodservice business due to
lower compensation costs and lower marketing expenses.
Other
Fiscal Year Ended
Sep 27,
2009
Sep 28,
2008
%
Change
Total specialty revenues ............................................ $ 124.2 $ 111.3 11.6%
Costofsales ...................................................... $ 71.7 $ 64.0 12.1%
Otheroperatingexpenses ............................................ 31.3 33.4 (6.2)%
Depreciationandamortizationexpenses ................................. 49.8 40.2 23.8%
Generalandadministrativeexpenses.................................... 254.4 265.8 (4.3)%
Restructuringcharges ............................................... 58.1 36.7 58.5%
Totaloperatingexpenses........................................... 465.3 440.1 5.7%
Operating loss .................................................. $(341.1) $(328.8) 3.7%
Substantially all of net revenues in Other are generated from the Seattle’s Best Coffee operating segment. The
increase in revenues for Seattle’s Best Coffee was primarily due to the increase in points of distribution for Seattle’s
Best Coffee including sales to new national accounts. Total operating expenses increased $25.2 million primarily as
a result of increased restructuring activities within the non-store support organization.
31