Starbucks 2010 Annual Report Download - page 29
Download and view the complete annual report
Please find page 29 of the 2010 Starbucks annual report below. You can navigate through the pages in the report by either clicking on the pages listed below, or by using the keyword search tool below to find specific information within the annual report.-
 1
1 -
2
-
3
-
4
-
5
-
6
-
7
-
8
-
9
-
10
-
11
-
12
-
13
-
14
-
15
-
16
-
17
-
18
-
 19
19 -
 20
20 -
 21
21 -
 22
22 -
 23
23 -
 24
24 -
 25
25 -
 26
26 -
 27
27 -
 28
28 -
 29
29 -
 30
30 -
 31
31 -
 32
32 -
 33
33 -
 34
34 -
 35
35 -
 36
36 -
 37
37 -
 38
38 -
 39
39 -
40
-
41
-
42
-
43
-
44
-
45
-
46
-
47
-
48
-
49
-
50
-
51
-
52
-
53
-
54
-
55
-
56
-
57
-
58
-
59
-
60
-
61
-
62
-
63
-
64
-
65
-
66
-
67
-
68
-
69
-
70
-
71
-
72
-
73
-
74
-
75
-
76
-
77
-
78
-
79
-
80
-
81
-
82
-
83
-
84
-
85
-
86
-
87
-
88
-
89
-
90
 |
 |
to shareholders. We generated $1.7 billion of operating cash flow in fiscal 2010 and finished the year with $1.4
billion in cash and short-term investments and no short-term debt. In fiscal 2010 we returned approximately $460
million of cash to our shareholders via share repurchases and dividends.
Fiscal 2011 — The View Ahead
• For fiscal 2011, we expect revenues to grow in the mid-to-high single digits based on a 52-week comparable
year, driven by low to mid single-digit comparable store sales growth. We plan to open approximately 500
net new stores globally in fiscal 2011; approximately 100 in the U.S. and approximately 400 internationally,
the majority of which are expected to be licensed stores.
• We expect modest improvement in our consolidated operating margin in fiscal 2011 compared to the prior
year, given our current revenue expectations, our anticipation of no restructuring charges in fiscal 2011,
along with ongoing marketing spend for Starbucks VIA®Ready Brew and higher coffee commodity costs.
• We expect capital expenditures to be approximately $550 million to $600 million for the full year.
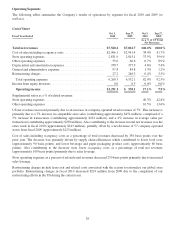
Operating Segment Overview
Starbucks has three reportable operating segments: US, International, and CPG. In the fourth fiscal quarter of 2010,
we changed the composition of our reportable segments by creating a Seattle’s Best Coffee operating segment and
reporting it with our unallocated corporate expenses and Digital Ventures in Other. Financial information for
Seattle’s Best Coffee was previously reported within the US, International, and CPG segments.
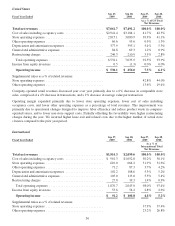
The US and International segments both include company-operated retail stores and licensed retail stores. Licensed
stores generally have a higher operating margin than company-operated stores. Under the licensed model, Starbucks
receives a reduced share of the total store revenues, but this is more than offset by the reduction in its share of costs
as these are primarily borne by the licensee. The International segment has a higher relative share of licensed stores
versus company-operated compared to the US segment; however, the US segment has been operating significantly
longer than the International segment and has developed deeper awareness of, and attachment to, the Starbucks
brand and stores among its customer base. As a result, the more mature US segment has significantly more stores,
and higher total revenues than the International segment. Average sales per store are also higher in the US due to
various factors including length of time in market and local income levels. Further, certain market costs, particularly
occupancy costs, are lower in the US segment compared to the average for the International segment, which
comprises a more diverse group of operations. As a result of the relative strength of the brand in the US segment, the
number of stores, the higher unit volumes, and the lower market costs, the US segment, despite its higher relative
percentage of company-operated stores, has a higher operating margin, excluding restructuring costs, than the less-
developed International segment.
Starbucks International store base continues to expand and as we continue to focus on achieving sustainable growth
from established international markets while at the same time investing in emerging markets, such as China and
Brazil. Newer international markets require a more extensive support organization, relative to the current levels of
revenue and operating income.
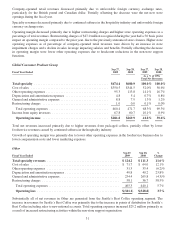
The CPG segment includes packaged coffee and tea and other branded products operations worldwide, and the US
foodservice business. For over ten years through licensing relationships with Kraft Foods Global, Inc., we have sold
a selection of Starbucks and Seattle’s Best Coffee branded packaged coffees and Tazo®teas in grocery and
warehouse club stores throughout the US, and to grocery stores in Canada, the UK and other European countries.
Kraft has managed the distribution, marketing, advertising and promotion of these products. In the first quarter of
fiscal 2011, Starbucks notified Kraft that we are discontinuing our licensing relationships. We intend to work closely
with Kraft to ensure an orderly transition. We also sell packaged coffee and tea internationally directly to warehouse
club stores, such as Costco Wholesale Corporation.
Our CPG segment also includes ready-to-drink beverages which are manufactured and distributed through The
North American Coffee Partnership, a joint venture with the Pepsi-Cola Company. In the CPG segment, most of the
customer revenues from the packaged coffee and ready-to-drink products are recognized as revenues by the licensed
or joint venture business partner. Royalties and payments from our licensing agreements are recorded under
licensing revenue, and the proportionate share of the results of the joint venture are included, on a net basis, in
23