Singapore Airlines 2012 Annual Report Download - page 98
Download and view the complete annual report
Please find page 98 of the 2012 Singapore Airlines annual report below. You can navigate through the pages in the report by either clicking on the pages listed below, or by using the keyword search tool below to find specific information within the annual report.-
 1
1 -
2
-
3
-
4
-
5
-
6
-
7
-
8
-
9
-
10
-
11
-
12
-
13
-
14
-
15
-
16
-
17
-
18
-
19
-
20
-
21
-
22
-
23
-
24
-
25
-
26
-
27
-
28
-
29
-
30
-
31
-
32
-
33
-
34
-
35
-
36
-
37
-
38
-
39
-
40
-
41
-
42
-
43
-
44
-
45
-
46
-
47
-
48
-
49
-
50
-
51
-
52
-
53
-
54
-
55
-
56
-
57
-
58
-
59
-
60
-
61
-
62
-
63
-
64
-
65
-
66
-
67
-
68
-
69
-
70
-
71
-
72
-
73
-
74
-
75
-
76
-
77
-
78
-
79
-
80
-
81
-
82
-
83
-
84
-
85
-
86
-
87
-
 88
88 -
 89
89 -
 90
90 -
 91
91 -
 92
92 -
 93
93 -
 94
94 -
 95
95 -
 96
96 -
 97
97 -
 98
98 -
 99
99 -
 100
100 -
 101
101 -
 102
102 -
 103
103 -
 104
104 -
 105
105 -
 106
106 -
 107
107 -
 108
108 -
109
-
110
-
111
-
112
-
113
-
114
-
115
-
116
-
117
-
118
-
119
-
120
-
121
-
122
-
123
-
124
-
125
-
126
-
127
-
128
-
129
-
130
-
131
-
132
-
133
-
134
-
135
-
136
-
137
-
138
-
139
-
140
-
141
-
142
-
143
-
144
-
145
-
146
-
147
-
148
-
149
-
150
-
151
-
152
-
153
-
154
-
155
-
156
-
157
-
158
-
159
-
160
-
161
-
162
-
163
-
164
-
165
-
166
-
167
-
168
-
169
-
170
-
171
-
172
-
173
-
174
-
175
-
176
-
177
-
178
-
179
-
180
-
181
-
182
-
183
-
184
-
185
-
186
-
187
-
188
-
189
-
190
-
191
-
192
-
193
-
194
-
195
-
196
-
197
-
198
-
199
-
200
-
201
-
202
-
203
-
204
-
205
-
206
 |
 |

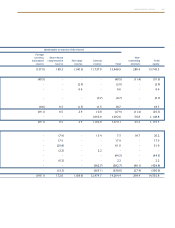
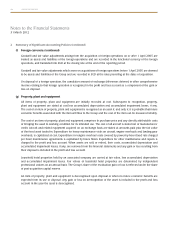
096 SINGAPORE AIRLINES
The Company
Share-based
Share Treasury Capital compensation Fair value General
Notes capital shares reserve reserve reserve reserve Total
Balance at 1 April 2011 1,832.4 (43.0) 2.5 138.5 (94.2) 12,298.9 14,135.1
Comprehensive income
Net fair value changes on
available-for-sale assets 16 - - - - (0.3) - (0.3)
Net fair value changes on
cash flow hedges 16 - - - - 84.7 - 84.7
Other comprehensive income
for the financial year - - - - 84.4 - 84.4
Profit for the financial year - - - - - 390.2 390.2
Total comprehensive income
for the financial year, net of tax - - - - 84.4 390.2 474.6
Transactions with owners,
recorded directly in equity
Share-based compensation expense - - - 14.7 - - 14.7
Share options exercised 14 23.7 - - (4.1) - - 19.6
Share options lapsed - - - (1.5) - 1.5 -
Purchase of treasury shares 15 - (272.1) - - - - (272.1)
Treasury shares reissued pursuant
to equity compensation plans 15 - 56.7 (10.6) (13.9) - - 32.2
Dividends 13 - - - - - (1,557.2) (1,557.2)
Total transactions with owners 23.7 (215.4) (10.6) (4.8) - (1,555.7) (1,762.8)
Balance at 31 March 2012 1,856.1 (258.4) (8.1) 133.7 (9.8) 11,133.4 12,846.9
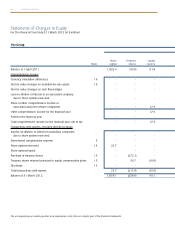
Statements of Changes in Equity
For The Financial Year Ended 31 March 2012 (In $ million)
The accompanying accounting policies and explanatory notes form an integral part of the financial statements.