Singapore Airlines 2012 Annual Report Download - page 91
Download and view the complete annual report
Please find page 91 of the 2012 Singapore Airlines annual report below. You can navigate through the pages in the report by either clicking on the pages listed below, or by using the keyword search tool below to find specific information within the annual report.-
 1
1 -
 2
2 -
 3
3 -
 4
4 -
 5
5 -
 6
6 -
 7
7 -
 8
8 -
 9
9 -
 10
10 -
 11
11 -
 12
12 -
 13
13 -
 14
14 -
 15
15 -
 16
16 -
 17
17 -
 18
18 -
 19
19 -
 20
20 -
 21
21 -
 22
22 -
 23
23 -
 24
24 -
 25
25 -
 26
26 -
 27
27 -
 28
28 -
 29
29 -
 30
30 -
 31
31 -
 32
32 -
 33
33 -
 34
34 -
 35
35 -
 36
36 -
 37
37 -
 38
38 -
 39
39 -
 40
40 -
 41
41 -
 42
42 -
 43
43 -
 44
44 -
 45
45 -
 46
46 -
 47
47 -
 48
48 -
 49
49 -
 50
50 -
 51
51 -
 52
52 -
 53
53 -
 54
54 -
 55
55 -
 56
56 -
 57
57 -
 58
58 -
 59
59 -
 60
60 -
 61
61 -
 62
62 -
 63
63 -
 64
64 -
 65
65 -
 66
66 -
 67
67 -
 68
68 -
 69
69 -
 70
70 -
 71
71 -
 72
72 -
 73
73 -
 74
74 -
 75
75 -
 76
76 -
 77
77 -
 78
78 -
 79
79 -
 80
80 -
 81
81 -
 82
82 -
 83
83 -
 84
84 -
 85
85 -
 86
86 -
 87
87 -
 88
88 -
 89
89 -
 90
90 -
 91
91 -
 92
92 -
 93
93 -
 94
94 -
 95
95 -
 96
96 -
 97
97 -
 98
98 -
 99
99 -
 100
100 -
 101
101 -
 102
102 -
 103
103 -
 104
104 -
 105
105 -
 106
106 -
 107
107 -
 108
108 -
 109
109 -
 110
110 -
 111
111 -
 112
112 -
 113
113 -
 114
114 -
 115
115 -
 116
116 -
 117
117 -
 118
118 -
 119
119 -
 120
120 -
 121
121 -
 122
122 -
 123
123 -
 124
124 -
 125
125 -
 126
126 -
 127
127 -
 128
128 -
 129
129 -
 130
130 -
 131
131 -
 132
132 -
 133
133 -
 134
134 -
 135
135 -
 136
136 -
 137
137 -
 138
138 -
 139
139 -
 140
140 -
 141
141 -
 142
142 -
 143
143 -
 144
144 -
 145
145 -
 146
146 -
 147
147 -
 148
148 -
 149
149 -
 150
150 -
 151
151 -
 152
152 -
 153
153 -
 154
154 -
 155
155 -
 156
156 -
 157
157 -
 158
158 -
 159
159 -
 160
160 -
 161
161 -
 162
162 -
 163
163 -
 164
164 -
 165
165 -
 166
166 -
 167
167 -
 168
168 -
 169
169 -
 170
170 -
 171
171 -
 172
172 -
 173
173 -
 174
174 -
 175
175 -
 176
176 -
 177
177 -
 178
178 -
 179
179 -
 180
180 -
 181
181 -
 182
182 -
 183
183 -
 184
184 -
 185
185 -
 186
186 -
 187
187 -
 188
188 -
 189
189 -
 190
190 -
 191
191 -
 192
192 -
 193
193 -
 194
194 -
 195
195 -
 196
196 -
 197
197 -
 198
198 -
 199
199 -
 200
200 -
 201
201 -
 202
202 -
 203
203 -
 204
204 -
 205
205 -
 206
206
 |
 |

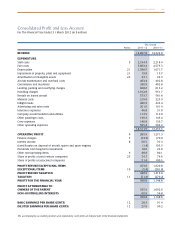
089ANNUAL REPORT 2011/2012
Consolidated Profit and Loss Account
For The Financial Year Ended 31 March 2012 (in $ million)
The Group
Notes 2011-12 2010-11
REVENUE 14,857.8 14,524.8
EXPENDITURE
Staff costs 5 2,194.4 2,218.4
Fuel costs 5,803.4 4,575.3
Depreciation 21 1,588.5 1,671.7
Impairment of property, plant and equipment 21 15.8 15.7
Amortisation of intangible assets 22 23.1 24.3
Aircraft maintenance and overhaul costs 463.4 402.8
Commission and incentives 330.9 402.8
Landing, parking and overflying charges 668.6 613.2
Handling charges 1,012.8 951.7
Rentals on leased aircraft 573.7 581.8
Material costs 219.0 223.9
Inflight meals 480.5 433.4
Advertising and sales costs 201.6 191.4
Insurance expenses 46.8 51.0
Company accommodation and utilities 113.9 112.8
Other passenger costs 139.3 145.4
Crew expenses 140.8 133.7
Other operating expenses 555.4 504.2
14,571.9 13,253.5
OPERATING PROFIT 6 285.9 1,271.3
Finance charges 7 (74.3) (70.1)
Interest income 8 50.5 37.3
(Loss)/Surplus on disposal of aircraft, spares and spare engines (1.4) 103.3
Dividends from long-term investments 18.0 23.8
Other non-operating items 9 48.8 80.1
Share of profits of joint venture companies 25 74.7 74.6
Share of profits of associated companies 51.4 100.5
PROFIT BEFORE EXCEPTIONAL ITEMS 453.6 1,620.8
EXCEPTIONAL ITEMS 10 (5.4) (201.8)
PROFIT BEFORE TAXATION 448.2 1,419.0
TAXATION 11 (51.4) (270.2)
PROFIT FOR THE FINANCIAL YEAR 396.8 1,148.8
PROFIT ATTRIBUTABLE TO:
OWNERS OF THE PARENT 335.9 1,092.0
NON-CONTROLLINGINTERESTS 60.9 56.8
396.8 1,148.8
BASIC EARNINGS PER SHARE (CENTS) 12 28.3 91.4
DILUTED EARNINGS PER SHARE (CENTS) 12 27.9 90.2
The accompanying accounting policies and explanatory notes form an integral part of the financial statements.
