Singapore Airlines 2012 Annual Report Download - page 150
Download and view the complete annual report
Please find page 150 of the 2012 Singapore Airlines annual report below. You can navigate through the pages in the report by either clicking on the pages listed below, or by using the keyword search tool below to find specific information within the annual report.-
 1
1 -
2
-
3
-
4
-
5
-
6
-
7
-
8
-
9
-
10
-
11
-
12
-
13
-
14
-
15
-
16
-
17
-
18
-
19
-
20
-
21
-
22
-
23
-
24
-
25
-
26
-
27
-
28
-
29
-
30
-
31
-
32
-
33
-
34
-
35
-
36
-
37
-
38
-
39
-
40
-
41
-
42
-
43
-
44
-
45
-
46
-
47
-
48
-
49
-
50
-
51
-
52
-
53
-
54
-
55
-
56
-
57
-
58
-
59
-
60
-
61
-
62
-
63
-
64
-
65
-
66
-
67
-
68
-
69
-
70
-
71
-
72
-
73
-
74
-
75
-
76
-
77
-
78
-
79
-
80
-
81
-
82
-
83
-
84
-
85
-
86
-
87
-
88
-
89
-
90
-
91
-
92
-
93
-
94
-
95
-
96
-
97
-
98
-
99
-
100
-
101
-
102
-
103
-
104
-
105
-
106
-
107
-
108
-
109
-
110
-
111
-
112
-
113
-
114
-
115
-
116
-
117
-
118
-
119
-
120
-
121
-
122
-
123
-
124
-
125
-
126
-
127
-
128
-
129
-
130
-
131
-
132
-
133
-
134
-
135
-
136
-
137
-
138
-
139
-
 140
140 -
 141
141 -
 142
142 -
 143
143 -
 144
144 -
 145
145 -
 146
146 -
 147
147 -
 148
148 -
 149
149 -
 150
150 -
 151
151 -
 152
152 -
 153
153 -
 154
154 -
 155
155 -
 156
156 -
 157
157 -
 158
158 -
 159
159 -
 160
160 -
161
-
162
-
163
-
164
-
165
-
166
-
167
-
168
-
169
-
170
-
171
-
172
-
173
-
174
-
175
-
176
-
177
-
178
-
179
-
180
-
181
-
182
-
183
-
184
-
185
-
186
-
187
-
188
-
189
-
190
-
191
-
192
-
193
-
194
-
195
-
196
-
197
-
198
-
199
-
200
-
201
-
202
-
203
-
204
-
205
-
206
 |
 |

148 SINGAPORE AIRLINES
Notes to the Financial Statements
31 March 2012
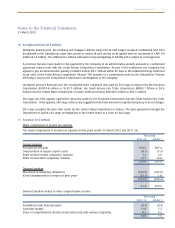
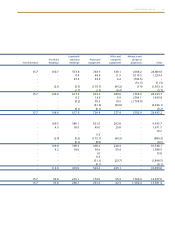
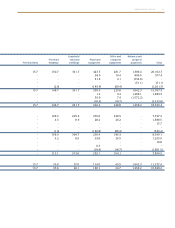
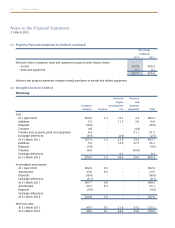
21 Property, Plant and Equipment (in $ million)
The Group
Aircraft Aircraft spare
Aircraft spares engines
Cost
At 1 April 2010 20,042.8 714.6 424.8
Additions 116.4 34.5 6.9
Transfers 657.3 (0.9) 7.8
Transfer to intangible assets - - -
Disposals (1,205.7) (61.0) (45.5)
Exchange differences - (0.3) -
At 31 March 2011 19,610.8 686.9 394.0
Additions 94.9 21.6 4.2
Transfers 1,709.7 - 7.7
Disposals (2,186.2) (93.7) (100.8)
Exchange differences - - -
At 31 March 2012 19,229.2 614.8 305.1
Accumulated depreciation and impairment loss
At 1 April 2010 7,567.9 404.7 202.2
Depreciation 1,506.9 33.4 29.8
Impairment loss 14.6 1.1 -
Transfers (30.4) (6.0) 36.1
Disposals (560.1) (42.6) (43.1)
Exchange differences - (0.1) -
At 31 March 2011 8,498.9 390.5 225.0
Depreciation 1,433.3 27.7 19.4
Impairment loss 14.3 0.2 0.3
Transfers (7.6) - 7.3
Disposals (1,733.9) (69.3) (40.5)
Exchange differences - - -
At 31 March 2012 8,205.0 349.1 211.5
Net book value
At 31 March 2011 11,111.9 296.4 169.0
At 31 March 2012 11,024.2 265.7 93.6