Singapore Airlines 2012 Annual Report Download - page 77
Download and view the complete annual report
Please find page 77 of the 2012 Singapore Airlines annual report below. You can navigate through the pages in the report by either clicking on the pages listed below, or by using the keyword search tool below to find specific information within the annual report.-
 1
1 -
2
-
3
-
4
-
5
-
6
-
7
-
8
-
9
-
10
-
11
-
12
-
13
-
14
-
15
-
16
-
17
-
18
-
19
-
20
-
21
-
22
-
23
-
24
-
25
-
26
-
27
-
28
-
29
-
30
-
31
-
32
-
33
-
34
-
35
-
36
-
37
-
38
-
39
-
40
-
41
-
42
-
43
-
44
-
45
-
46
-
47
-
48
-
49
-
50
-
51
-
52
-
53
-
54
-
55
-
56
-
57
-
58
-
59
-
60
-
61
-
62
-
63
-
64
-
65
-
66
-
 67
67 -
 68
68 -
 69
69 -
 70
70 -
 71
71 -
 72
72 -
 73
73 -
 74
74 -
 75
75 -
 76
76 -
 77
77 -
 78
78 -
 79
79 -
 80
80 -
 81
81 -
 82
82 -
 83
83 -
 84
84 -
 85
85 -
 86
86 -
 87
87 -
88
-
89
-
90
-
91
-
92
-
93
-
94
-
95
-
96
-
97
-
98
-
99
-
100
-
101
-
102
-
103
-
104
-
105
-
106
-
107
-
108
-
109
-
110
-
111
-
112
-
113
-
114
-
115
-
116
-
117
-
118
-
119
-
120
-
121
-
122
-
123
-
124
-
125
-
126
-
127
-
128
-
129
-
130
-
131
-
132
-
133
-
134
-
135
-
136
-
137
-
138
-
139
-
140
-
141
-
142
-
143
-
144
-
145
-
146
-
147
-
148
-
149
-
150
-
151
-
152
-
153
-
154
-
155
-
156
-
157
-
158
-
159
-
160
-
161
-
162
-
163
-
164
-
165
-
166
-
167
-
168
-
169
-
170
-
171
-
172
-
173
-
174
-
175
-
176
-
177
-
178
-
179
-
180
-
181
-
182
-
183
-
184
-
185
-
186
-
187
-
188
-
189
-
190
-
191
-
192
-
193
-
194
-
195
-
196
-
197
-
198
-
199
-
200
-
201
-
202
-
203
-
204
-
205
-
206
 |
 |
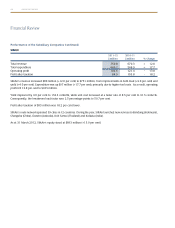
075ANNUAL REPORT 2011/2012
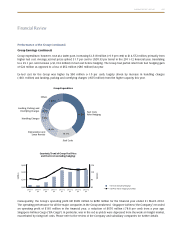
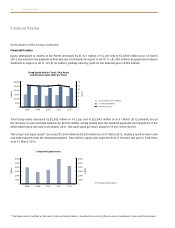
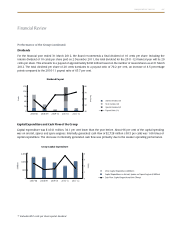
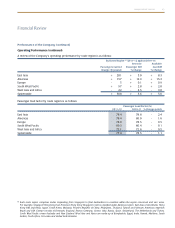
Financial Review
Performance of the Company (continued)
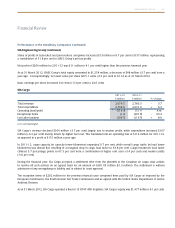
Fuel Productivity and Sensitivity Analysis
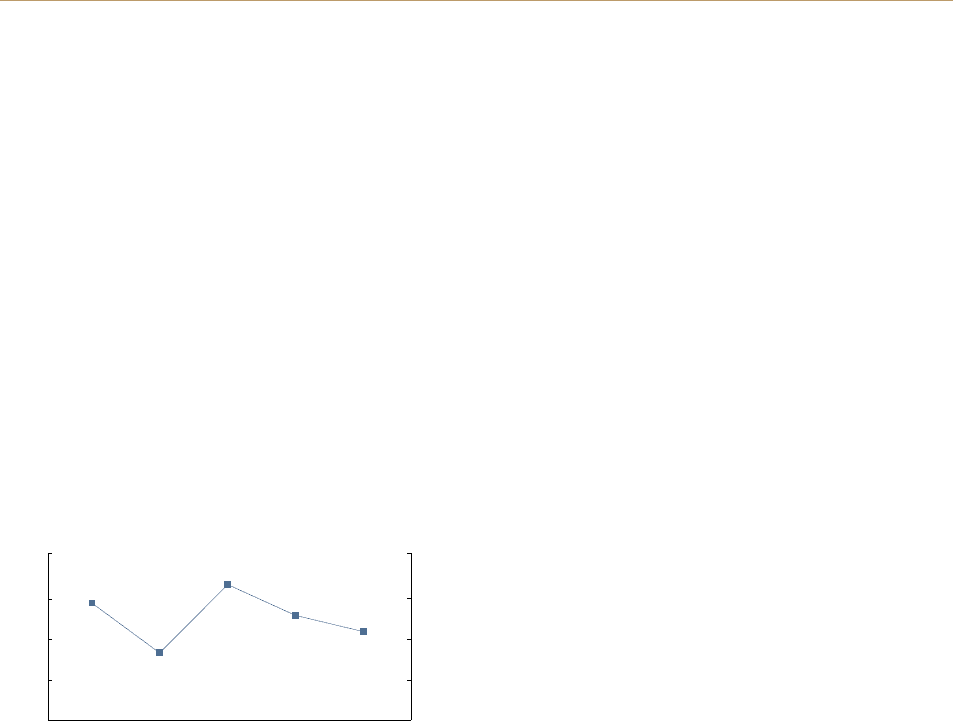
Fuel productivity as measured by load tonne-km per barrel (ltk/BBL) decreased 1.0 per cent over the previous year to 421ltk/BBL.
This was mainly due to a decline in the overall load factor.
A change in fuel productivity (passenger aircraft) of 1.0 per cent would impact the Company’s annual fuel cost by about $49
million, before accounting for changes in fuel price, USD exchange rate and flying operations.
A change in the price of fuel of one USD per barrel affects the Company’s annual fuel cost by about $37 million, before
accounting for USD exchange movements, and changes in volume of fuel consumed.
Finance Charges
Finance charges were 11.5 per cent higher in 2011-12, mainly from interest expense incurred for the $500 million 10-year
bond (issued in July 2010) bearing interest of 3.22 per cent per annum and $300 million 5-year bond (issued in September
2010) bearing interest of 2.15 per cent per annum. This was partially offset by a reduction in interest cost after the repayment
of the $900 million fixed rate note in December 2011.
Interest Income
Interest income was up 29.5 per cent in 2011-12, largely from the increase in investments and deposits and higher interest rates.
Surplus on Disposal of Aircraft, Spares and Spare Engines
The loss on disposal of aircraft, spares and spare engines arose mainly from the loss on sale of the last B747-400 aircraft,
partially compensated by the gain on sale and leaseback of four B777-300 engines and one A380-800 aircraft. In contrast,
the Company made a gain of $99 million last year on the sale of four B777-200 aircraft and the sale and leaseback of one
A380-800 aircraft.
Taxation
There was a net tax expense of $23 million, comprising current tax charge of $152 million and deferred tax credit of $129 million.
As at 31 March 2012, the Company’s deferred taxation account stood at $1,695 million.
Fuel Productivity of Passenger Fleet
LTK/BBL
440
430
420
410
400
LTK/BBL
430
440
400
410
420
2007-08 2008-09 2009-10 2010-11 2011-12