Singapore Airlines 2012 Annual Report Download - page 140
Download and view the complete annual report
Please find page 140 of the 2012 Singapore Airlines annual report below. You can navigate through the pages in the report by either clicking on the pages listed below, or by using the keyword search tool below to find specific information within the annual report.-
 1
1 -
2
-
3
-
4
-
5
-
6
-
7
-
8
-
9
-
10
-
11
-
12
-
13
-
14
-
15
-
16
-
17
-
18
-
19
-
20
-
21
-
22
-
23
-
24
-
25
-
26
-
27
-
28
-
29
-
30
-
31
-
32
-
33
-
34
-
35
-
36
-
37
-
38
-
39
-
40
-
41
-
42
-
43
-
44
-
45
-
46
-
47
-
48
-
49
-
50
-
51
-
52
-
53
-
54
-
55
-
56
-
57
-
58
-
59
-
60
-
61
-
62
-
63
-
64
-
65
-
66
-
67
-
68
-
69
-
70
-
71
-
72
-
73
-
74
-
75
-
76
-
77
-
78
-
79
-
80
-
81
-
82
-
83
-
84
-
85
-
86
-
87
-
88
-
89
-
90
-
91
-
92
-
93
-
94
-
95
-
96
-
97
-
98
-
99
-
100
-
101
-
102
-
103
-
104
-
105
-
106
-
107
-
108
-
109
-
110
-
111
-
112
-
113
-
114
-
115
-
116
-
117
-
118
-
119
-
120
-
121
-
122
-
123
-
124
-
125
-
126
-
127
-
128
-
129
-
 130
130 -
 131
131 -
 132
132 -
 133
133 -
 134
134 -
 135
135 -
 136
136 -
 137
137 -
 138
138 -
 139
139 -
 140
140 -
 141
141 -
 142
142 -
 143
143 -
 144
144 -
 145
145 -
 146
146 -
 147
147 -
 148
148 -
 149
149 -
 150
150 -
151
-
152
-
153
-
154
-
155
-
156
-
157
-
158
-
159
-
160
-
161
-
162
-
163
-
164
-
165
-
166
-
167
-
168
-
169
-
170
-
171
-
172
-
173
-
174
-
175
-
176
-
177
-
178
-
179
-
180
-
181
-
182
-
183
-
184
-
185
-
186
-
187
-
188
-
189
-
190
-
191
-
192
-
193
-
194
-
195
-
196
-
197
-
198
-
199
-
200
-
201
-
202
-
203
-
204
-
205
-
206
 |
 |
138 SINGAPORE AIRLINES
Notes to the Financial Statements
31 March 2012
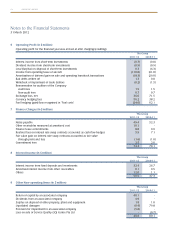
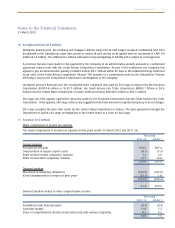
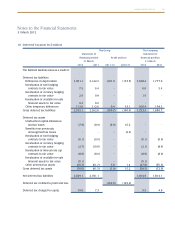
6 Operating Profit (in $ million)
Operating profit for the financial year was arrived at after charging/(crediting):
The Group
2011-12 2010-11
Interest income from short-term investments (0.7) (0.8)
Dividend income from short-term investments (0.9) (0.9)
Loss/(Surplus) on disposal of short-term investments 0.3 (6.3)
Income from operating lease of aircraft (116.8) (91.8)
Amortisation of deferred gain on sale and operating leaseback transactions (18.3) (29.0)
Bad debts written off 1.3 0.8
Writeback of impairment of trade debtors (0.2) (1.5)
Remuneration for auditors of the Company
Audit fees 1.5 1.5
Non-audit fees 0.7 0.7
Exchange loss, net 36.6 71.5
Currency hedging loss 56.2 38.2
Fuel hedging (gain)/loss recognised in “Fuel costs” (24.0) 62.1
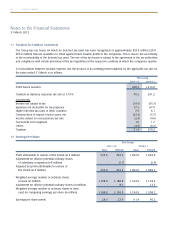
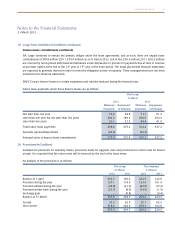
7 FinanceCharges(in$million)
The Group
2011-12 2010-11
Notes payable 49.4 52.3
Other receivables measured at amortised cost 10.1 -
Finance lease commitments 8.0 9.9
Realised loss on interest rate swap contracts accounted as cash flow hedges 5.9 7.1
Fair value gain on interest rate swap contracts accounted as fair value
through profit and loss (1.6) (1.8)
Commitment fees 2.5 2.6
74.3 70.1
8 Interest Income (in $ million)
The Group
2011-12 2010-11
Interest income from fixed deposits and investments 32.4 26.7
Amortised interest income from other receivables 6.1 9.5
Others 12.0 1.1
50.5 37.3
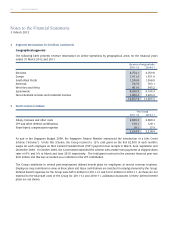
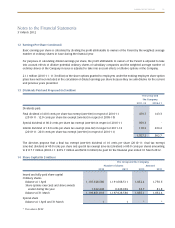
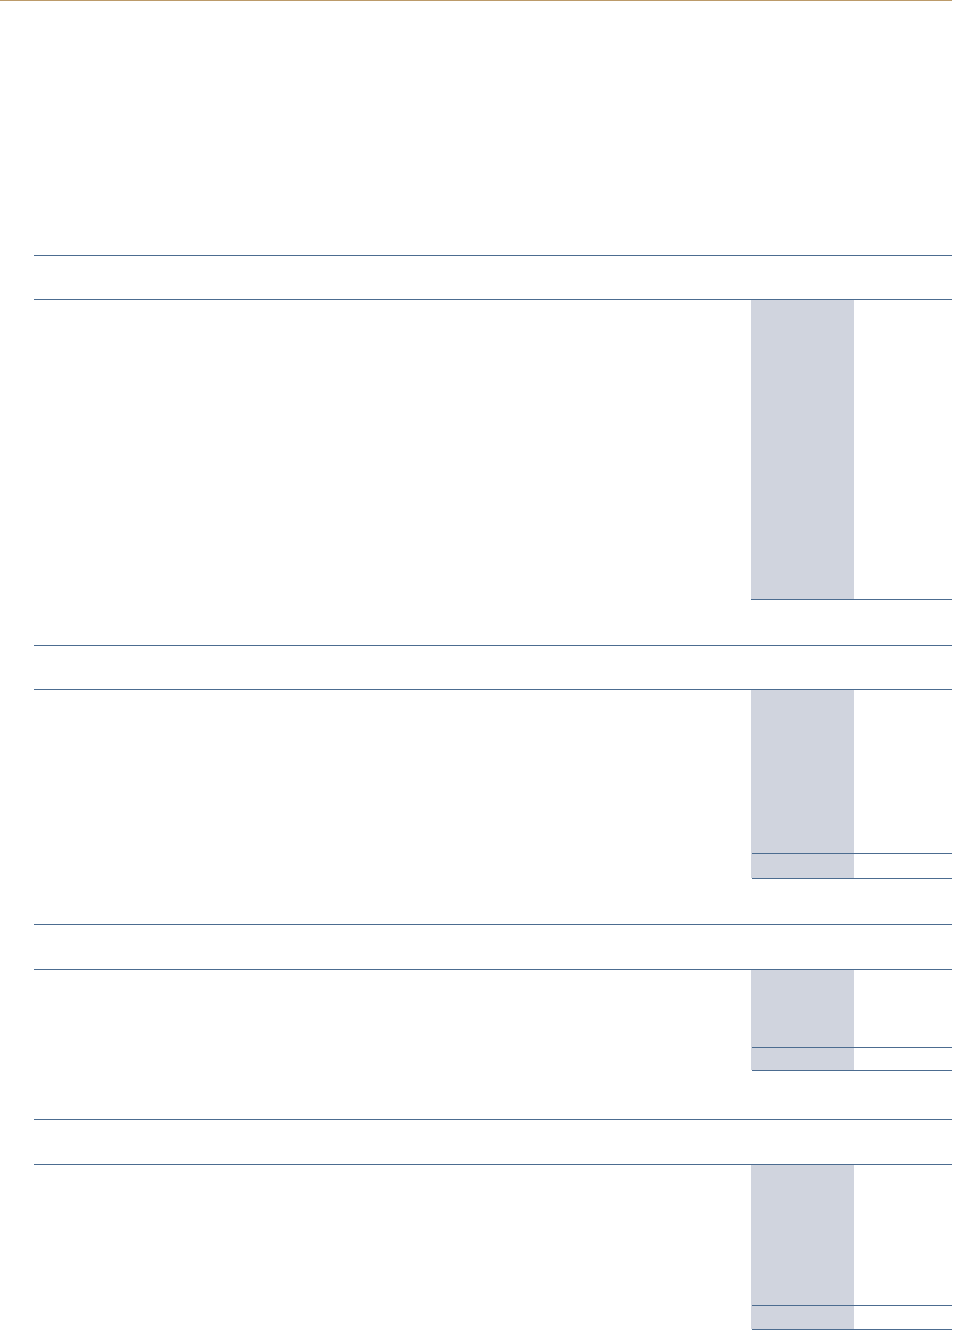
9 OtherNon-operatingItems(in$million)
The Group
2011-12 2010-11
Return of capital by an associated company 48.1 -
Dividends from an associated company 4.9 -
Surplus on disposal of other property, plant and equipment 1.8 1.0
Liquidated damages (0.4) 79.8
Provision for impairment in an associated company (5.6) -
Loss on sale of Service Quality (SQ) Centre Pte Ltd - (0.7)
48.8 80.1