Singapore Airlines 2012 Annual Report Download - page 69
Download and view the complete annual report
Please find page 69 of the 2012 Singapore Airlines annual report below. You can navigate through the pages in the report by either clicking on the pages listed below, or by using the keyword search tool below to find specific information within the annual report.-
 1
1 -
2
-
3
-
4
-
5
-
6
-
7
-
8
-
9
-
10
-
11
-
12
-
13
-
14
-
15
-
16
-
17
-
18
-
19
-
20
-
21
-
22
-
23
-
24
-
25
-
26
-
27
-
28
-
29
-
30
-
31
-
32
-
33
-
34
-
35
-
36
-
37
-
38
-
39
-
40
-
41
-
42
-
43
-
44
-
45
-
46
-
47
-
48
-
49
-
50
-
51
-
52
-
53
-
54
-
55
-
56
-
57
-
58
-
 59
59 -
 60
60 -
 61
61 -
 62
62 -
 63
63 -
 64
64 -
 65
65 -
 66
66 -
 67
67 -
 68
68 -
 69
69 -
 70
70 -
 71
71 -
 72
72 -
 73
73 -
 74
74 -
 75
75 -
 76
76 -
 77
77 -
 78
78 -
 79
79 -
80
-
81
-
82
-
83
-
84
-
85
-
86
-
87
-
88
-
89
-
90
-
91
-
92
-
93
-
94
-
95
-
96
-
97
-
98
-
99
-
100
-
101
-
102
-
103
-
104
-
105
-
106
-
107
-
108
-
109
-
110
-
111
-
112
-
113
-
114
-
115
-
116
-
117
-
118
-
119
-
120
-
121
-
122
-
123
-
124
-
125
-
126
-
127
-
128
-
129
-
130
-
131
-
132
-
133
-
134
-
135
-
136
-
137
-
138
-
139
-
140
-
141
-
142
-
143
-
144
-
145
-
146
-
147
-
148
-
149
-
150
-
151
-
152
-
153
-
154
-
155
-
156
-
157
-
158
-
159
-
160
-
161
-
162
-
163
-
164
-
165
-
166
-
167
-
168
-
169
-
170
-
171
-
172
-
173
-
174
-
175
-
176
-
177
-
178
-
179
-
180
-
181
-
182
-
183
-
184
-
185
-
186
-
187
-
188
-
189
-
190
-
191
-
192
-
193
-
194
-
195
-
196
-
197
-
198
-
199
-
200
-
201
-
202
-
203
-
204
-
205
-
206
 |
 |

067ANNUAL REPORT 2011/2012
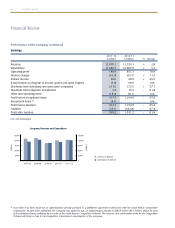
Financial Review
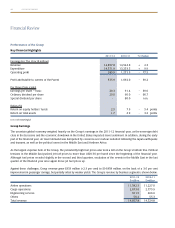
Performance of the Group (continued)
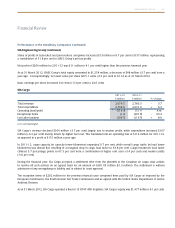
Dividends
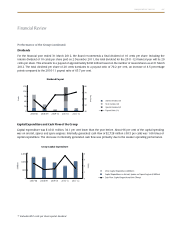
For the financial year ended 31 March 2012, the Board recommends a final dividend of 10 cents per share. Including the
interim dividend of 10 cents per share paid on 2 December 2011, the total dividend for the 2011-12 financial year will be 20
cents per share. This amounts to a payout of approximately $236 million based on the number of issued shares as at 31 March
2012. The total dividend per share of 20 cents translates to a payout ratio of 70.2 per cent, an increase of 4.5 percentage
points compared to the 2010-11 payout ratio of 65.7 per cent.
Capital Expenditure and Cash Flow of the Group
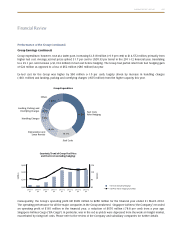
Capital expenditure was $1,641 million, 34.1 per cent lower than the year before. About 96 per cent of the capital spending
was on aircraft, spares and spare engines. Internally generated cash flow of $2,728 million (-38.5 per cent) was 1.66 times of
capital expenditure. The decrease in internally generated cash flow was primarily due to the weaker operating performance.
R2 Excludes 80.0 cents per share special dividend.
Dividend Payout
Group Capital Expenditure
Cents
$ Million
150
2,400
120
90
1,600
60
30
800
0
0
Per Cent
Times
50
1
60
2
70
3
80
4
40
0
2007-08
2007-08
2008-09
2008-09
2009-10
2009-10
2010-11
2010-11
2011-12
2011-12
R2