Singapore Airlines 2012 Annual Report Download - page 72
Download and view the complete annual report
Please find page 72 of the 2012 Singapore Airlines annual report below. You can navigate through the pages in the report by either clicking on the pages listed below, or by using the keyword search tool below to find specific information within the annual report.-
 1
1 -
2
-
3
-
4
-
5
-
6
-
7
-
8
-
9
-
10
-
11
-
12
-
13
-
14
-
15
-
16
-
17
-
18
-
19
-
20
-
21
-
22
-
23
-
24
-
25
-
26
-
27
-
28
-
29
-
30
-
31
-
32
-
33
-
34
-
35
-
36
-
37
-
38
-
39
-
40
-
41
-
42
-
43
-
44
-
45
-
46
-
47
-
48
-
49
-
50
-
51
-
52
-
53
-
54
-
55
-
56
-
57
-
58
-
59
-
60
-
61
-
 62
62 -
 63
63 -
 64
64 -
 65
65 -
 66
66 -
 67
67 -
 68
68 -
 69
69 -
 70
70 -
 71
71 -
 72
72 -
 73
73 -
 74
74 -
 75
75 -
 76
76 -
 77
77 -
 78
78 -
 79
79 -
 80
80 -
 81
81 -
 82
82 -
83
-
84
-
85
-
86
-
87
-
88
-
89
-
90
-
91
-
92
-
93
-
94
-
95
-
96
-
97
-
98
-
99
-
100
-
101
-
102
-
103
-
104
-
105
-
106
-
107
-
108
-
109
-
110
-
111
-
112
-
113
-
114
-
115
-
116
-
117
-
118
-
119
-
120
-
121
-
122
-
123
-
124
-
125
-
126
-
127
-
128
-
129
-
130
-
131
-
132
-
133
-
134
-
135
-
136
-
137
-
138
-
139
-
140
-
141
-
142
-
143
-
144
-
145
-
146
-
147
-
148
-
149
-
150
-
151
-
152
-
153
-
154
-
155
-
156
-
157
-
158
-
159
-
160
-
161
-
162
-
163
-
164
-
165
-
166
-
167
-
168
-
169
-
170
-
171
-
172
-
173
-
174
-
175
-
176
-
177
-
178
-
179
-
180
-
181
-
182
-
183
-
184
-
185
-
186
-
187
-
188
-
189
-
190
-
191
-
192
-
193
-
194
-
195
-
196
-
197
-
198
-
199
-
200
-
201
-
202
-
203
-
204
-
205
-
206
 |
 |

070 SINGAPORE AIRLINES
Financial Review
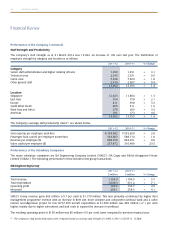
Performance of the Company
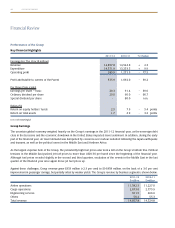
Operating Performance
2011-12 2010-11 %Change
Passengers carried (thousand) 17,155 16,647 + 3.1
Available seat-km (million) 113,409.7 108,060.2 + 5.0
Revenue passenger-km (million) 87,824.0 84,801.3 + 3.6
Passenger load factor (%) 77.4 78.5 - 1.1 points
Passenger yield (¢/pkm) 11.8 11.9 - 0.8
Passenger unit cost (¢/ask) 9.2 8.9 + 3.4
Passenger breakeven load factor (%) 78.0 74.8 + 3.2 points
During the financial year, travel demand was affected by the ongoing economic uncertainties in the Eurozone and the United
States, as well as natural disasters such as the Japan earthquake and tsunami and the floods in Thailand. Passenger carriage
growth of 3.6 per cent could not keep up with the capacity expansion of 5.0 per cent. As a result, passenger load factor of 77.4
per cent was 1.1 percentage points lower year-on-year.
Passenger yield was marginally lower from promotional activities necessitated by intense competition amongst airlines and
efforts to stimulate travel demand.
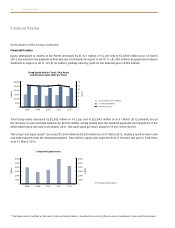
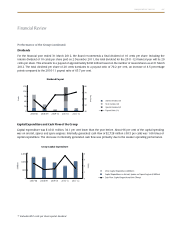
Avaliable Seat Capacity,
Passenger Traffic and Load Factor
Million
120,000
80,000
100,000
60,000
40,000
20,000
0
Per Cent
81
79
77
85
83
75
2007-08 2008-09 2009-10 2010-11 2011-12
Available Seat-km (Million)
Revenue Passenger-km (Million)
Passenger Load Factor (%)