Singapore Airlines 2012 Annual Report Download - page 156
Download and view the complete annual report
Please find page 156 of the 2012 Singapore Airlines annual report below. You can navigate through the pages in the report by either clicking on the pages listed below, or by using the keyword search tool below to find specific information within the annual report.-
 1
1 -
2
-
3
-
4
-
5
-
6
-
7
-
8
-
9
-
10
-
11
-
12
-
13
-
14
-
15
-
16
-
17
-
18
-
19
-
20
-
21
-
22
-
23
-
24
-
25
-
26
-
27
-
28
-
29
-
30
-
31
-
32
-
33
-
34
-
35
-
36
-
37
-
38
-
39
-
40
-
41
-
42
-
43
-
44
-
45
-
46
-
47
-
48
-
49
-
50
-
51
-
52
-
53
-
54
-
55
-
56
-
57
-
58
-
59
-
60
-
61
-
62
-
63
-
64
-
65
-
66
-
67
-
68
-
69
-
70
-
71
-
72
-
73
-
74
-
75
-
76
-
77
-
78
-
79
-
80
-
81
-
82
-
83
-
84
-
85
-
86
-
87
-
88
-
89
-
90
-
91
-
92
-
93
-
94
-
95
-
96
-
97
-
98
-
99
-
100
-
101
-
102
-
103
-
104
-
105
-
106
-
107
-
108
-
109
-
110
-
111
-
112
-
113
-
114
-
115
-
116
-
117
-
118
-
119
-
120
-
121
-
122
-
123
-
124
-
125
-
126
-
127
-
128
-
129
-
130
-
131
-
132
-
133
-
134
-
135
-
136
-
137
-
138
-
139
-
140
-
141
-
142
-
143
-
144
-
145
-
 146
146 -
 147
147 -
 148
148 -
 149
149 -
 150
150 -
 151
151 -
 152
152 -
 153
153 -
 154
154 -
 155
155 -
 156
156 -
 157
157 -
 158
158 -
 159
159 -
 160
160 -
 161
161 -
 162
162 -
 163
163 -
 164
164 -
 165
165 -
 166
166 -
167
-
168
-
169
-
170
-
171
-
172
-
173
-
174
-
175
-
176
-
177
-
178
-
179
-
180
-
181
-
182
-
183
-
184
-
185
-
186
-
187
-
188
-
189
-
190
-
191
-
192
-
193
-
194
-
195
-
196
-
197
-
198
-
199
-
200
-
201
-
202
-
203
-
204
-
205
-
206
 |
 |

154 SINGAPORE AIRLINES
Notes to the Financial Statements
31 March 2012
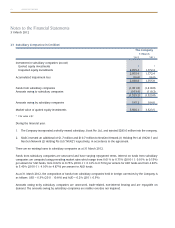
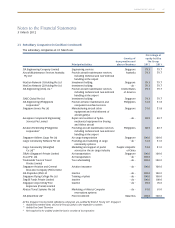
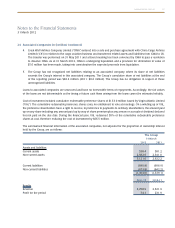
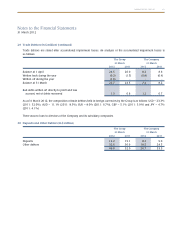
23 Subsidiary Companies (in $ million)
The Company
31 March
2012 2011
Investment in subsidiary companies (at cost)
Quoted equity investments # #
Unquoted equity investments 2,055.4 1,772.4
2,055.4 1,772.4
Accumulated impairment loss (16.6) (16.6)
2,038.8 1,755.8
Funds from subsidiary companies (1,361.8) (1,418.8)
Amounts owing to subsidiary companies (163.4) (110.2)
(1,525.2) (1,529.0)
Amounts owing by subsidiary companies 195.2 194.0
Market value of quoted equity investments 3,506.1 3,523.5
# The value is $1.
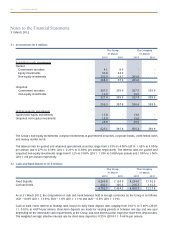
During the financial year:
1. The Company incorporated a wholly-owned subsidiary, Scoot Pte. Ltd., and injected $283.0 million into the company.
2. SIAEC invested an additional of $1.7 million and $10.7 million to NexGen Network (1) Holding Pte Ltd (“NGN1”) and
NexGen Network (2) Holding Pte Ltd (“NGN2”) respectively, in accordance to the agreement.
There are no existing loans to subsidiary companies as at 31 March 2012.
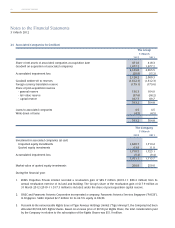
Funds from subsidiary companies are unsecured and have varying repayment terms. Interest on funds from subsidiary
companies are computed using prevailing market rates which range from 0.01% to 0.75% (2010-11: 0.01% to 0.55%)
per annum for SGD funds, from 0.02% to 0.75% (2010-11: 0.14% to 0.73%) per annum for USD funds and from 4.40%
to 5.40% (2010-11: 4.10% to 4.87%) per annum for AUD funds.
As at 31 March 2012, the composition of funds from subsidiary companies held in foreign currencies by the Company is
as follows: USD – 6.3% (2011: 10.8%) and AUD – 0.2% (2011: 0.3%).
Amounts owing to/by subsidiary companies are unsecured, trade-related, non-interest bearing and are repayable on
demand. The amounts owing by subsidiary companies are neither overdue nor impaired.