Singapore Airlines 2012 Annual Report Download - page 93
Download and view the complete annual report
Please find page 93 of the 2012 Singapore Airlines annual report below. You can navigate through the pages in the report by either clicking on the pages listed below, or by using the keyword search tool below to find specific information within the annual report.-
 1
1 -
2
-
3
-
4
-
5
-
6
-
7
-
8
-
9
-
10
-
11
-
12
-
13
-
14
-
15
-
16
-
17
-
18
-
19
-
20
-
21
-
22
-
23
-
24
-
25
-
26
-
27
-
28
-
29
-
30
-
31
-
32
-
33
-
34
-
35
-
36
-
37
-
38
-
39
-
40
-
41
-
42
-
43
-
44
-
45
-
46
-
47
-
48
-
49
-
50
-
51
-
52
-
53
-
54
-
55
-
56
-
57
-
58
-
59
-
60
-
61
-
62
-
63
-
64
-
65
-
66
-
67
-
68
-
69
-
70
-
71
-
72
-
73
-
74
-
75
-
76
-
77
-
78
-
79
-
80
-
81
-
82
-
 83
83 -
 84
84 -
 85
85 -
 86
86 -
 87
87 -
 88
88 -
 89
89 -
 90
90 -
 91
91 -
 92
92 -
 93
93 -
 94
94 -
 95
95 -
 96
96 -
 97
97 -
 98
98 -
 99
99 -
 100
100 -
 101
101 -
 102
102 -
 103
103 -
104
-
105
-
106
-
107
-
108
-
109
-
110
-
111
-
112
-
113
-
114
-
115
-
116
-
117
-
118
-
119
-
120
-
121
-
122
-
123
-
124
-
125
-
126
-
127
-
128
-
129
-
130
-
131
-
132
-
133
-
134
-
135
-
136
-
137
-
138
-
139
-
140
-
141
-
142
-
143
-
144
-
145
-
146
-
147
-
148
-
149
-
150
-
151
-
152
-
153
-
154
-
155
-
156
-
157
-
158
-
159
-
160
-
161
-
162
-
163
-
164
-
165
-
166
-
167
-
168
-
169
-
170
-
171
-
172
-
173
-
174
-
175
-
176
-
177
-
178
-
179
-
180
-
181
-
182
-
183
-
184
-
185
-
186
-
187
-
188
-
189
-
190
-
191
-
192
-
193
-
194
-
195
-
196
-
197
-
198
-
199
-
200
-
201
-
202
-
203
-
204
-
205
-
206
 |
 |
091ANNUAL REPORT 2011/2012
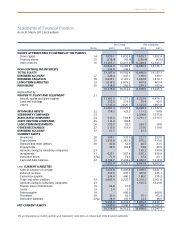
Statements of Financial Position
As At 31 March 2012 (In $ million)
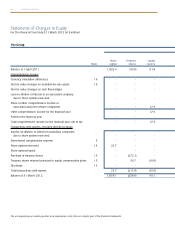
The accompanying accounting policies and explanatory notes form an integral part of the financial statements.
The Group The Company
Notes 2012 2011 2012 2011
EQUITY ATTRIBUTABLE TO OWNERS OF THE PARENT
Share capital 14 1,856.1 1,832.4 1,856.1 1,832.4
Treasury shares 15 (258.4) (43.0) (258.4) (43.0)
Other reserves 16 11,295.7 12,415.0 11,249.2 12,345.7
12,893.4 14,204.4 12,846.9 14,135.1
NON-CONTROLLINGINTERESTS 294.0 298.4 - -
TOTAL EQUITY 13,187.4 14,502.8 12,846.9 14,135.1
DEFERRED ACCOUNT 17 224.4 347.1 199.9 330.7
DEFERRED TAXATION 18 2,029.1 2,181.1 1,694.8 1,814.1
LONG-TERMLIABILITIES 19 1,018.5 1,079.2 807.9 803.4
PROVISIONS 20 318.6 202.0 259.1 162.0
16,778.0 18,312.2 15,808.6 17,245.3
Represented by:
PROPERTY, PLANT AND EQUIPMENT 21
Aircraft, spares and spare engines 11,383.5 11,577.3 9,223.9 9,479.1
Land and buildings 252.0 274.6 79.4 92.5
Others 1,745.9 2,025.7 1,525.0 1,805.8
13,381.4 13,877.6 10,828.3 11,377.4
INTANGIBLE ASSETS 22 158.3 125.2 111.2 90.8
SUBSIDIARY COMPANIES 23 - - 2,038.8 1,755.8
ASSOCIATED COMPANIES 24 543.2 504.8 1,701.1 1,715.7
JOINT VENTURE COMPANIES 25 113.2 102.8 - -
LONG-TERMINVESTMENTS 26 373.7 35.3 293.7 18.8
OTHER RECEIVABLES 27 215.6 119.6 215.6 119.6
DEFERRED ACCOUNT 17 51.7 - 33.7 -
CURRENT ASSETS
Inventories 28 306.1 335.5 221.7 253.9
Trade debtors 29 1,354.8 1,381.8 870.2 913.6
Deposits and other debtors 30 46.8 52.0 26.7 33.5
Prepayments 98.5 103.6 74.8 89.5
Amounts owing by subsidiary companies 23 - - 195.2 194.0
Investments 31 625.1 397.8 565.2 339.9
Derivative assets 37(a) 71.9 74.3 57.4 63.1
Cash and bank balances 32 4,702.7 7,434.2 4,450.7 7,217.8
7,205.9 9,779.2 6,461.9 9,105.3
Less: CURRENT LIABILITIES
Sales in advance of carriage 1,456.8 1,459.8 1,409.5 1,421.1
Deferred revenue 497.0 445.1 497.0 445.1
Current tax payable 244.4 440.2 186.0 370.3
Trade and other creditors 33 2,885.4 2,725.7 2,210.2 2,161.8
Amounts owing to subsidiary companies 23 - - 1,525.2 1,529.0
Finance lease commitments 19 64.8 61.4 - -
Loans 19 2.4 1.7 - -
Notes payable 19 - 900.0 - 900.0
Provisions 20 35.3 62.5 35.1 62.3
Derivative liabilities 37(a) 78.9 135.9 12.7 48.5
5,265.0 6,232.3 5,875.7 6,938.1
NET CURRENT ASSETS 1,940.9 3,546.9 586.2 2,167.2
16,778.0 18,312.2 15,808.6 17,245.3