Singapore Airlines 2012 Annual Report Download - page 137
Download and view the complete annual report
Please find page 137 of the 2012 Singapore Airlines annual report below. You can navigate through the pages in the report by either clicking on the pages listed below, or by using the keyword search tool below to find specific information within the annual report.-
 1
1 -
2
-
3
-
4
-
5
-
6
-
7
-
8
-
9
-
10
-
11
-
12
-
13
-
14
-
15
-
16
-
17
-
18
-
19
-
20
-
21
-
22
-
23
-
24
-
25
-
26
-
27
-
28
-
29
-
30
-
31
-
32
-
33
-
34
-
35
-
36
-
37
-
38
-
39
-
40
-
41
-
42
-
43
-
44
-
45
-
46
-
47
-
48
-
49
-
50
-
51
-
52
-
53
-
54
-
55
-
56
-
57
-
58
-
59
-
60
-
61
-
62
-
63
-
64
-
65
-
66
-
67
-
68
-
69
-
70
-
71
-
72
-
73
-
74
-
75
-
76
-
77
-
78
-
79
-
80
-
81
-
82
-
83
-
84
-
85
-
86
-
87
-
88
-
89
-
90
-
91
-
92
-
93
-
94
-
95
-
96
-
97
-
98
-
99
-
100
-
101
-
102
-
103
-
104
-
105
-
106
-
107
-
108
-
109
-
110
-
111
-
112
-
113
-
114
-
115
-
116
-
117
-
118
-
119
-
120
-
121
-
122
-
123
-
124
-
125
-
126
-
 127
127 -
 128
128 -
 129
129 -
 130
130 -
 131
131 -
 132
132 -
 133
133 -
 134
134 -
 135
135 -
 136
136 -
 137
137 -
 138
138 -
 139
139 -
 140
140 -
 141
141 -
 142
142 -
 143
143 -
 144
144 -
 145
145 -
 146
146 -
 147
147 -
148
-
149
-
150
-
151
-
152
-
153
-
154
-
155
-
156
-
157
-
158
-
159
-
160
-
161
-
162
-
163
-
164
-
165
-
166
-
167
-
168
-
169
-
170
-
171
-
172
-
173
-
174
-
175
-
176
-
177
-
178
-
179
-
180
-
181
-
182
-
183
-
184
-
185
-
186
-
187
-
188
-
189
-
190
-
191
-
192
-
193
-
194
-
195
-
196
-
197
-
198
-
199
-
200
-
201
-
202
-
203
-
204
-
205
-
206
 |
 |

135ANNUAL REPORT 2011/2012
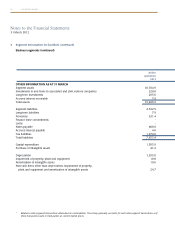
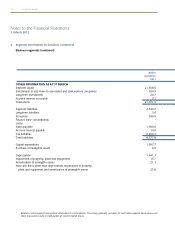
Notes to the Financial Statements
31 March 2012
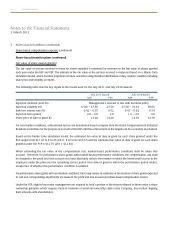
5 Staff Costs (in $ million) (continued)
Share-based compensation expense (continued)
Share-basedincentiveplans(continued)
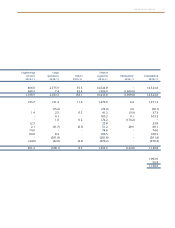
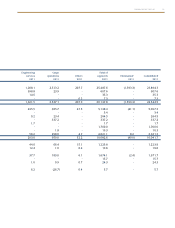
Movement of share awards during the financial year
Number of Restricted Shares
Balance at
1.4.2011/ Balanceat
Dateofgrant dateofgrant Adjustment* Vested Modications^ Cancelled 31.03.2012
RSP
1.8.2007 116,928 - (116,928) - - -
1.7.2008 210,440 - (122,889) 5,156 (1,154) 91,553
29.7.2009 634,809 (110,029) (310,960) 12,615 (4,034) 222,401
22.07.2010 527,300 - - 31,165 (11,438) 547,027
01.07.2011 553,160 - - 32,690 (12,582) 573,268
2,042,637 (110,029) (550,777) 81,626 (29,208) 1,434,249
* Adjustment at the end of two-year performance period upon meeting performance targets and adjustments for number of days in service
for retirees.
^ Following approval by the Company’s shareholders of the declaration of a special dividend of $0.80 per share on 29 July 2011, the Board
Compensation & Industrial Relations Committee approved an increase in all restricted shares outstanding on 18 August 2011 under the RSP.
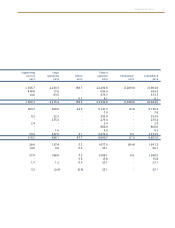
Number of Performance Shares
Balance at
1.4.2011/ Balanceat
Dateofgrant dateofgrant Adjustment* Vested Modications^ 31.03.2012
PSP
1.7.2008 224,224 68,006 (292,230) - -
29.7.2009 193,760 - - 11,462 205,222
22.07.2010 155,400 - - 9,190 164,590
01.07.2011 145,400 - - 8,599 153,999
718,784 68,006 (292,230) 29,251 523,811
* Adjustment at the end of three-year performance period upon meeting performance targets and adjustment for number of days in service
for retirees.
^ Following approval by the Company’s shareholders of the declaration of a special dividend of $0.80 per share on 29 July 2011, the Board
Compensation & Industrial Relations Committee approved an increase in all performance shares outstanding on 18 August 2011 under
the PSP.