Singapore Airlines 2012 Annual Report Download - page 66
Download and view the complete annual report
Please find page 66 of the 2012 Singapore Airlines annual report below. You can navigate through the pages in the report by either clicking on the pages listed below, or by using the keyword search tool below to find specific information within the annual report.-
 1
1 -
2
-
3
-
4
-
5
-
6
-
7
-
8
-
9
-
10
-
11
-
12
-
13
-
14
-
15
-
16
-
17
-
18
-
19
-
20
-
21
-
22
-
23
-
24
-
25
-
26
-
27
-
28
-
29
-
30
-
31
-
32
-
33
-
34
-
35
-
36
-
37
-
38
-
39
-
40
-
41
-
42
-
43
-
44
-
45
-
46
-
47
-
48
-
49
-
50
-
51
-
52
-
53
-
54
-
55
-
 56
56 -
 57
57 -
 58
58 -
 59
59 -
 60
60 -
 61
61 -
 62
62 -
 63
63 -
 64
64 -
 65
65 -
 66
66 -
 67
67 -
 68
68 -
 69
69 -
 70
70 -
 71
71 -
 72
72 -
 73
73 -
 74
74 -
 75
75 -
 76
76 -
77
-
78
-
79
-
80
-
81
-
82
-
83
-
84
-
85
-
86
-
87
-
88
-
89
-
90
-
91
-
92
-
93
-
94
-
95
-
96
-
97
-
98
-
99
-
100
-
101
-
102
-
103
-
104
-
105
-
106
-
107
-
108
-
109
-
110
-
111
-
112
-
113
-
114
-
115
-
116
-
117
-
118
-
119
-
120
-
121
-
122
-
123
-
124
-
125
-
126
-
127
-
128
-
129
-
130
-
131
-
132
-
133
-
134
-
135
-
136
-
137
-
138
-
139
-
140
-
141
-
142
-
143
-
144
-
145
-
146
-
147
-
148
-
149
-
150
-
151
-
152
-
153
-
154
-
155
-
156
-
157
-
158
-
159
-
160
-
161
-
162
-
163
-
164
-
165
-
166
-
167
-
168
-
169
-
170
-
171
-
172
-
173
-
174
-
175
-
176
-
177
-
178
-
179
-
180
-
181
-
182
-
183
-
184
-
185
-
186
-
187
-
188
-
189
-
190
-
191
-
192
-
193
-
194
-
195
-
196
-
197
-
198
-
199
-
200
-
201
-
202
-
203
-
204
-
205
-
206
 |
 |

064 SINGAPORE AIRLINES
Financial Review
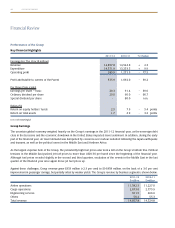
Performance of the Group
Key Financial Highlights
2011-12 2010-11 %Change
Earnings For The Year ($ million)
Revenue 14,857.8 14,524.8 + 2.3
Expenditure 14,571.9 13,253.5 + 9.9
Operating profit 285.9 1,271.3 - 77.5
Profit attributable to owners of the Parent 335.9 1,092.0 - 69.2
Per Share Data (cents)
Earnings per share – basic 28.3 91.4 - 69.0
Ordinary dividend per share 20.0 60.0 - 66.7
Special dividend per share - 80.0 n.m.
Ratios (%)
Return on equity holders’ funds 2.5 7.9 - 5.4 points
Return on total assets 1.7 4.9 - 3.2 points
n.m. not meaningful
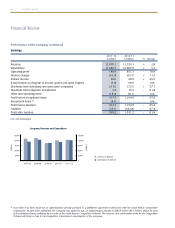
Group Earnings
The uncertain global economy weighed heavily on the Group’s earnings in the 2011-12 financial year, as the sovereign debt
crisis in the Eurozone and the economic slowdown in the United States impacted travel sentiment. In addition, during the early
part of the financial year, air travel demand was dampened by concerns over nuclear radiation following the Japan earthquake
and tsunami, as well as the political unrest in the Middle East and Northern Africa.
As the largest expense item of the Group, the persistently high fuel prices also took a toll on the Group’s bottom line. Political
tensions in the Middle East pushed jet fuel prices to more than USD130 per barrel since the beginning of the financial year.
Although fuel prices receded slightly in the second and third quarters, escalation of the events in the Middle East in the last
quarter of the financial year once again drove jet fuel prices up.
Against these challenges, Group revenue grew $333 million (+2.3 per cent) to $14,858 million, on the back of a 3.6 per cent
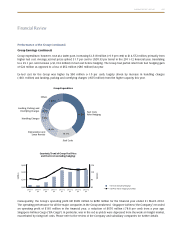
improvement in passenger carriage, but partially offset by weaker yields. The Group’s revenue by business segment is shown below:
2011-12 2010-11
$ million $ million
Airline operations 11,582.3 11,227.0
Cargo operations 2,673.6 2,775.9
Engineering services 551.5 466.6
Others 50.4 55.3
Total revenue 14,857.8 14,524.8