Singapore Airlines 2012 Annual Report Download - page 195
Download and view the complete annual report
Please find page 195 of the 2012 Singapore Airlines annual report below. You can navigate through the pages in the report by either clicking on the pages listed below, or by using the keyword search tool below to find specific information within the annual report.-
 1
1 -
2
-
3
-
4
-
5
-
6
-
7
-
8
-
9
-
10
-
11
-
12
-
13
-
14
-
15
-
16
-
17
-
18
-
19
-
20
-
21
-
22
-
23
-
24
-
25
-
26
-
27
-
28
-
29
-
30
-
31
-
32
-
33
-
34
-
35
-
36
-
37
-
38
-
39
-
40
-
41
-
42
-
43
-
44
-
45
-
46
-
47
-
48
-
49
-
50
-
51
-
52
-
53
-
54
-
55
-
56
-
57
-
58
-
59
-
60
-
61
-
62
-
63
-
64
-
65
-
66
-
67
-
68
-
69
-
70
-
71
-
72
-
73
-
74
-
75
-
76
-
77
-
78
-
79
-
80
-
81
-
82
-
83
-
84
-
85
-
86
-
87
-
88
-
89
-
90
-
91
-
92
-
93
-
94
-
95
-
96
-
97
-
98
-
99
-
100
-
101
-
102
-
103
-
104
-
105
-
106
-
107
-
108
-
109
-
110
-
111
-
112
-
113
-
114
-
115
-
116
-
117
-
118
-
119
-
120
-
121
-
122
-
123
-
124
-
125
-
126
-
127
-
128
-
129
-
130
-
131
-
132
-
133
-
134
-
135
-
136
-
137
-
138
-
139
-
140
-
141
-
142
-
143
-
144
-
145
-
146
-
147
-
148
-
149
-
150
-
151
-
152
-
153
-
154
-
155
-
156
-
157
-
158
-
159
-
160
-
161
-
162
-
163
-
164
-
165
-
166
-
167
-
168
-
169
-
170
-
171
-
172
-
173
-
174
-
175
-
176
-
177
-
178
-
179
-
180
-
181
-
182
-
183
-
184
-
 185
185 -
 186
186 -
 187
187 -
 188
188 -
 189
189 -
 190
190 -
 191
191 -
 192
192 -
 193
193 -
 194
194 -
 195
195 -
 196
196 -
 197
197 -
 198
198 -
 199
199 -
 200
200 -
 201
201 -
 202
202 -
 203
203 -
 204
204 -
 205
205 -
206
 |
 |

193ANNUAL REPORT 2011/2012
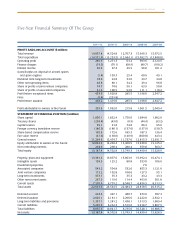
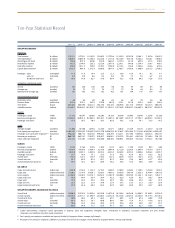
Ten-Year Statistical Record
2011-12 2010-11 2009-10 2008-09 2007-08 2006-07 2005-06 2004-05 2003-04 2002-03
SINGAPORE AIRLINES
FINANCIAL
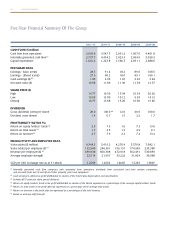
Total revenue ($ million) 12,070.1 11,739.1 10,145.0 13,049.5 12,759.6 11,343.9 10,302.8 9,260.1 7,187.6 8,047.0
Total expenditure ($ million) 11,889.5 10,887.8 10,183.6 12,226.6 11,115.6 10,316.9 9,651.8 8,562.2 7,046.1 7,838.0
Operating profit /(loss) ($ million) 180.6 851.3 (38.6) 822.9 1,644.0 1,027.0 651.0 697.9 141.5 209.0
Profit before taxation ($ million) 413.3 1,194.0 233.3 1,252.4 2,077.6 2,291.1 940.8 1,570.4 319.7 460.1
Profit after taxation ($ million) 390.2 1,011.2 279.8 1,218.7 1,758.8 2,213.2 746.0 1,283.6 420.6 618.0
Capital disbursements R1 ($ million) 1,762.7 981.9 1,372.4 1,698.6 1,814.4 2,792.7 1,458.6 1,608.9 2,051.3 2,766.2
Passenger - yield (cents/pkm) 11.8 11.9 10.4 12.5 12.1 10.9 10.6 10.1 9.2 9.1
- unit cost (cents/ask) 9.2 8.9 8.6 9.2 8.4 7.9 7.5 7.0 6.7 6.7
- breakeven load factor (%) 78.0 74.8 82.7 73.6 69.4 72.5 70.8 69.3 72.8 73.6
OPERATING PASSENGER FLEET
Aircraft (numbers) 100 108 108 103 98 94 90 89 85 96
Average age (months) 74 75 75 74 77 75 76 64 60 71
Industry-wide average age (months) 151 163 162 162 162 161 159 157 156 155
PASSENGER PRODUCTION
Destination cities (numbers) 63 64 68 66 65 64 62 59 56 60
Distance flown (million km) 374.6 354.1 342.4 379.8 365.9 353.1 341.8 325.4 266.7 296.2
Time flown (hours) 490,261 460,096 443,141 492,103 474,432 458,936 441,510 419,925 342,715 384,652
Available seat-km (million) 113,409.7 108,060.2 105,673.7 117,788.7 113,919.1 112,543.8 109,483.7 104,662.3 88,252.7 99,565.9
TRAFFIC
Passengers carried (‘000) 17,155 16,647 16,480 18,293 19,120 18,346 16,995 15,944 13,278 15,326
Revenue passenger-km (million) 87,824.0 84,801.3 82,882.5 90,128.1 91,485.2 89,148.8 82,741.7 77,593.7 64,685.2 74,183.2
Passenger load factor (%) 77.4 78.5 78.4 76.5 80.3 79.2 75.6 74.1 73.3 74.5
STAFF
Average strength (numbers) 13,893 13,588 13,934 14,343 14,071 13,847 13,729 13,572 14,010 14,418
Seat capacity per employee R2 (seat-km) 8,163,082 7,952,620 7,583,874 8,212,278 8,096,020 8,127,667 7,974,630 7,711,634 6,299,265 6,905,667
Passenger load carried per employee R3 (tonne-km) 594,663 588,714 563,318 598,047 618,295 613,211 577,784 549,904 448,513 495,617
Revenue per employee ($) 868,790 863,931 728,075 909,817 906,801 819,232 750,441 682,294 513,034 558,122
Value added per employee ($) 237,472 310,480 219,678 294,666 368,382 368,831 258,810 301,024 179,272 191,566
SILKAIR
Passengers carried (‘000) 3,032 2,764 2,356 1,954 1,815 1,616 1,259 1,044 845 948
Revenue passenger-km (million) 4,469.4 4,039.6 3,466.4 3,158.6 3,094.9 2,712.9 2,208.0 1,895.6 1,453.0 1,555.7
Available seat-km (million) 5,904.8 5,285.1 4,495.9 4,355.2 4,323.0 3,865.8 3,295.3 2,909.6 2,296.4 2,495.7
Passenger load factor (%) 75.7 76.4 77.1 72.5 71.6 70.2 67.0 65.2 63.3 62.3
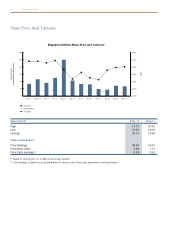
Overall yield (cents/ltk) 153.3 147.4 137.9 156.2 147.2 140.8 138.7 134.4 131.6 144.0
Overall unit cost (cents/ctk) 91.5 84.3 87.4 95.1 85.7 83.6 79.4 66.9 65.7 65.6
Overall breakeven load factor (%) 59.7 57.2 63.3 60.9 58.2 59.3 57.3 49.8 49.9 45.6
SIA CARGO
Cargo and mail carried (million kg) 1,205.8 1,156.4 1,122.4 1,219.5 1,308.0 1,284.9 1,248.5 1,149.5 1,050.9 1,043.2
Cargo load (million tonne-km) 7,198.2 7,174.0 6,659.1 7,299.3 7,959.2 7,995.6 7,874.4 7,333.2 6,749.4 6,913.6
Gross capacity (million tonne-km) 11,286.5 11,208.5 10,510.1 12,292.5 12,787.8 12,889.8 12,378.9 11,544.1 10,156.5 9,927.1
Cargo load factor (%) 63.8 64.0 63.4 59.4 62.2 62.0 63.6 63.5 66.5 69.6
Cargo yield (cents/ltk) 34.9 36.2 32.0 38.2 38.7 38.4 38.6 35.9 36.7 34.2
Cargo unit cost (cents/ctk) 23.5 22.3 21.9 24.9 23.4 24.5 23.5 21.3 23.0 23.9
Cargo breakeven load factor (%) 67.3 61.6 68.4 65.2 60.5 63.8 60.9 59.3 62.7 69.9
SINGAPORE AIRLINES, SILKAIR AND SIA CARGO
Overall load (million tonne-km) 15,898.8 15,576.3 14,853.6 16,196.8 16,973.8 16,765.6 16,036.8 14,996.5 13,189.3 14,224.9
Overall capacity (million tonne-km) 23,378.6 22,515.1 21,495.9 24,468.5 24,572.6 24,474.8 23,605.5 22,267.8 19,177.5 20,103.4
Overall load factor (%) 68.0 69.2 69.1 66.2 69.1 68.5 67.9 67.3 68.8 70.8
Overall yield (cents/ltk) 85.5 85.5 76.1 89.8 86.0 78.4 75.4 71.5 65.6 65.3
Overall unit cost (cents/ctk) 58.6 55.4 54.6 58.4 52.9 50.6 48.2 44.8 43.7 45.7
Overall breakeven load factor (%) 68.5 64.8 71.7 65.0 61.5 64.5 63.9 62.7 66.6 70.0
R1 Capital disbursements comprised capital expenditure in property, plant and equipment, intangible assets, investments in subsidiary, associated companies and joint venture
companies, and additional long-term equity investments.
R2 Seat capacity per employee is available seat capacity divided by Singapore Airlines’ average staff strength.
R3 Passenger load carried per employee is defined as passenger load and excess baggage carried divided by Singapore Airlines’ average staff strength.