Singapore Airlines 2012 Annual Report Download - page 75
Download and view the complete annual report
Please find page 75 of the 2012 Singapore Airlines annual report below. You can navigate through the pages in the report by either clicking on the pages listed below, or by using the keyword search tool below to find specific information within the annual report.-
 1
1 -
2
-
3
-
4
-
5
-
6
-
7
-
8
-
9
-
10
-
11
-
12
-
13
-
14
-
15
-
16
-
17
-
18
-
19
-
20
-
21
-
22
-
23
-
24
-
25
-
26
-
27
-
28
-
29
-
30
-
31
-
32
-
33
-
34
-
35
-
36
-
37
-
38
-
39
-
40
-
41
-
42
-
43
-
44
-
45
-
46
-
47
-
48
-
49
-
50
-
51
-
52
-
53
-
54
-
55
-
56
-
57
-
58
-
59
-
60
-
61
-
62
-
63
-
64
-
 65
65 -
 66
66 -
 67
67 -
 68
68 -
 69
69 -
 70
70 -
 71
71 -
 72
72 -
 73
73 -
 74
74 -
 75
75 -
 76
76 -
 77
77 -
 78
78 -
 79
79 -
 80
80 -
 81
81 -
 82
82 -
 83
83 -
 84
84 -
 85
85 -
86
-
87
-
88
-
89
-
90
-
91
-
92
-
93
-
94
-
95
-
96
-
97
-
98
-
99
-
100
-
101
-
102
-
103
-
104
-
105
-
106
-
107
-
108
-
109
-
110
-
111
-
112
-
113
-
114
-
115
-
116
-
117
-
118
-
119
-
120
-
121
-
122
-
123
-
124
-
125
-
126
-
127
-
128
-
129
-
130
-
131
-
132
-
133
-
134
-
135
-
136
-
137
-
138
-
139
-
140
-
141
-
142
-
143
-
144
-
145
-
146
-
147
-
148
-
149
-
150
-
151
-
152
-
153
-
154
-
155
-
156
-
157
-
158
-
159
-
160
-
161
-
162
-
163
-
164
-
165
-
166
-
167
-
168
-
169
-
170
-
171
-
172
-
173
-
174
-
175
-
176
-
177
-
178
-
179
-
180
-
181
-
182
-
183
-
184
-
185
-
186
-
187
-
188
-
189
-
190
-
191
-
192
-
193
-
194
-
195
-
196
-
197
-
198
-
199
-
200
-
201
-
202
-
203
-
204
-
205
-
206
 |
 |

073ANNUAL REPORT 2011/2012
Financial Review
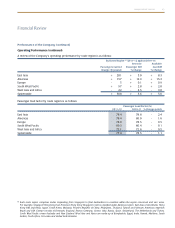
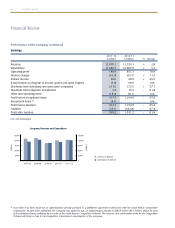
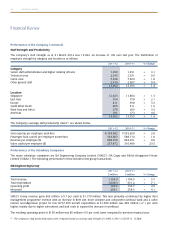
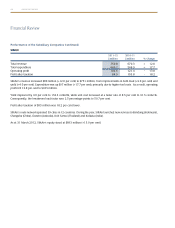
Performance of the Company (continued)
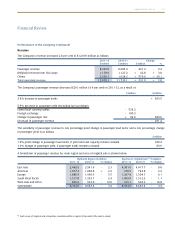
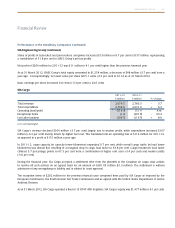
Revenue
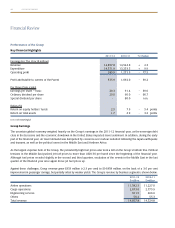
The Company’s revenue increased 2.8 per cent to $12,070 million as follows:
2011-12 2010-11 Change
$million $million $million %
Passenger revenue 8,392.0 8,683.4 - 291.4 - 3.4
Bellyhold revenue from SIA Cargo 1,170.0 1,127.2 + 42.8 + 3.8
Others 2,508.1 1,928.5 + 579.6 + 30.1
Total operating revenue 12,070.1 11,739.1 + 331.0 + 2.8
The Company’s passenger revenue decreased $291 million (-3.4 per cent) in 2011-12, as a result of:
$ million $ million
3.6% increase in passenger traffic: + 309.5
5.9% decrease in passenger yield (excluding fuel surcharge):
Lower local currency yields - 554.2
Foreign exchange - 109.3
Change in passenger mix + 62.6 - 600.9
Decrease in passenger revenue - 291.4
The sensitivity of passenger revenue to one percentage point change in passenger load factor and a one percentage change
in passenger yield is as follows:
$ million
1.0% point change in passenger load factor, if yield and seat capacity remain constant 108.4
1.0% change in passenger yield, if passenger traffic remains constant 83.9
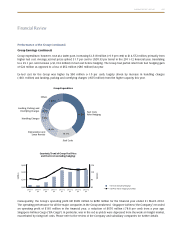
A breakdown of passenger revenue by route region and area of original sale is shown below:
By Route Region ($ million) By Area of Original Sale R6 ($ million)
2011-12 2010-11 % Change 2011-12 2010-11 % Change
East Asia 2,482.6 2,541.6 - 2.3 4,381.6 4,417.7 - 0.8
Americas 1,677.3 1,638.8 + 2.3 728.5 744.8 - 2.2
Europe 1,885.9 1,996.3 - 5.5 1,367.8 1,504.7 - 9.1
South West Pacific 1,517.0 1,553.7 - 2.4 1,495.0 1,512.3 - 1.1
West Asia and Africa 829.2 953.0 - 13.0 419.1 503.9 - 16.8
Systemwide 8,392.0 8,683.4 - 3.4 8,392.0 8,683.4 - 3.4
R6 Each area of original sale comprises countries within a region from which the sale is made.