Singapore Airlines 2012 Annual Report Download - page 159
Download and view the complete annual report
Please find page 159 of the 2012 Singapore Airlines annual report below. You can navigate through the pages in the report by either clicking on the pages listed below, or by using the keyword search tool below to find specific information within the annual report.-
 1
1 -
2
-
3
-
4
-
5
-
6
-
7
-
8
-
9
-
10
-
11
-
12
-
13
-
14
-
15
-
16
-
17
-
18
-
19
-
20
-
21
-
22
-
23
-
24
-
25
-
26
-
27
-
28
-
29
-
30
-
31
-
32
-
33
-
34
-
35
-
36
-
37
-
38
-
39
-
40
-
41
-
42
-
43
-
44
-
45
-
46
-
47
-
48
-
49
-
50
-
51
-
52
-
53
-
54
-
55
-
56
-
57
-
58
-
59
-
60
-
61
-
62
-
63
-
64
-
65
-
66
-
67
-
68
-
69
-
70
-
71
-
72
-
73
-
74
-
75
-
76
-
77
-
78
-
79
-
80
-
81
-
82
-
83
-
84
-
85
-
86
-
87
-
88
-
89
-
90
-
91
-
92
-
93
-
94
-
95
-
96
-
97
-
98
-
99
-
100
-
101
-
102
-
103
-
104
-
105
-
106
-
107
-
108
-
109
-
110
-
111
-
112
-
113
-
114
-
115
-
116
-
117
-
118
-
119
-
120
-
121
-
122
-
123
-
124
-
125
-
126
-
127
-
128
-
129
-
130
-
131
-
132
-
133
-
134
-
135
-
136
-
137
-
138
-
139
-
140
-
141
-
142
-
143
-
144
-
145
-
146
-
147
-
148
-
 149
149 -
 150
150 -
 151
151 -
 152
152 -
 153
153 -
 154
154 -
 155
155 -
 156
156 -
 157
157 -
 158
158 -
 159
159 -
 160
160 -
 161
161 -
 162
162 -
 163
163 -
 164
164 -
 165
165 -
 166
166 -
 167
167 -
 168
168 -
 169
169 -
170
-
171
-
172
-
173
-
174
-
175
-
176
-
177
-
178
-
179
-
180
-
181
-
182
-
183
-
184
-
185
-
186
-
187
-
188
-
189
-
190
-
191
-
192
-
193
-
194
-
195
-
196
-
197
-
198
-
199
-
200
-
201
-
202
-
203
-
204
-
205
-
206
 |
 |
157ANNUAL REPORT 2011/2012
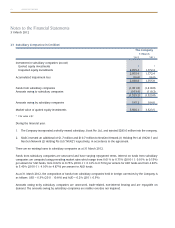
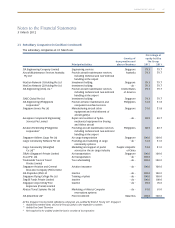
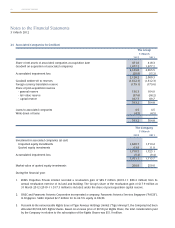
Notes to the Financial Statements
31 March 2012
24 Associated Companies (in $ million) (continued)
4. Great Wall Airlines Company Limited (“GWA”) entered into a sale and purchase agreement with China Cargo Airlines
Limited (“CK”) in relation to the cargo aviation business and transferred related assets and liabilities from GWA to CK.
The transfer was performed on 31 May 2011 and a Board meeting has been convened by GWA to pass a resolution
to dissolve GWA. As at 31 March 2012, GWA is undergoing liquidation and a provision for diminution in value of
$5.6 million has been made, taking into consideration the expected proceeds from liquidation.
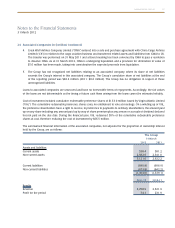
5. The Group has not recognised net liabilities relating to an associated company where its share of net liabilities
exceeds the Group’s interest in this associated company. The Group’s cumulative share of net liabilities at the end
of the reporting period was $96.4 million (2011: $0.6 million). The Group has no obligation in respect of these
unrecognised liabilities.
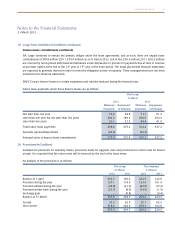
Loans to associated companies are unsecured and have no foreseeable terms of repayments. Accordingly, the fair values
of the loans are not determinable as the timing of future cash flows arising from the loans cannot be estimated reliably.
Cost of investment included cumulative redeemable preference shares of $133.0 million issued by Virgin Atlantic Limited
(“VAL”). The cumulative redeemable preference shares carry no entitlement to vote at meetings. On a winding up of VAL,
the preference shareholders have a right to receive, in preference to payments to ordinary shareholders, the amount paid
up on any share including any amount paid up by way of share premium plus any arrears or accruals of dividend declared
but not paid on the due date. During the financial year, VAL redeemed 50% of the cumulative redeemable preference
shares at cost, therefore reducing the cost of investment by $66.5 million.
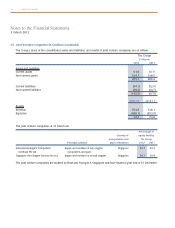
The summarised financial information of the associated companies, not adjusted for the proportion of ownership interest
held by the Group, are as follows:
The Group
31 March
2012 2011
Assets and liabilities
Current assets 538.4 581.2
Non-current assets 2,582.6 2,341.0
3,121.0 2,922.2
Current liabilities (690.8) (696.9)
Non-current liabilities (673.8) (642.2)
(1,364.6) (1,339.1)
2011-12 2010-11
Results
Revenue 2,708.9 2,521.9
Profit for the period 74.1 231.9