Singapore Airlines 2012 Annual Report Download - page 142
Download and view the complete annual report
Please find page 142 of the 2012 Singapore Airlines annual report below. You can navigate through the pages in the report by either clicking on the pages listed below, or by using the keyword search tool below to find specific information within the annual report.-
 1
1 -
2
-
3
-
4
-
5
-
6
-
7
-
8
-
9
-
10
-
11
-
12
-
13
-
14
-
15
-
16
-
17
-
18
-
19
-
20
-
21
-
22
-
23
-
24
-
25
-
26
-
27
-
28
-
29
-
30
-
31
-
32
-
33
-
34
-
35
-
36
-
37
-
38
-
39
-
40
-
41
-
42
-
43
-
44
-
45
-
46
-
47
-
48
-
49
-
50
-
51
-
52
-
53
-
54
-
55
-
56
-
57
-
58
-
59
-
60
-
61
-
62
-
63
-
64
-
65
-
66
-
67
-
68
-
69
-
70
-
71
-
72
-
73
-
74
-
75
-
76
-
77
-
78
-
79
-
80
-
81
-
82
-
83
-
84
-
85
-
86
-
87
-
88
-
89
-
90
-
91
-
92
-
93
-
94
-
95
-
96
-
97
-
98
-
99
-
100
-
101
-
102
-
103
-
104
-
105
-
106
-
107
-
108
-
109
-
110
-
111
-
112
-
113
-
114
-
115
-
116
-
117
-
118
-
119
-
120
-
121
-
122
-
123
-
124
-
125
-
126
-
127
-
128
-
129
-
130
-
131
-
 132
132 -
 133
133 -
 134
134 -
 135
135 -
 136
136 -
 137
137 -
 138
138 -
 139
139 -
 140
140 -
 141
141 -
 142
142 -
 143
143 -
 144
144 -
 145
145 -
 146
146 -
 147
147 -
 148
148 -
 149
149 -
 150
150 -
 151
151 -
 152
152 -
153
-
154
-
155
-
156
-
157
-
158
-
159
-
160
-
161
-
162
-
163
-
164
-
165
-
166
-
167
-
168
-
169
-
170
-
171
-
172
-
173
-
174
-
175
-
176
-
177
-
178
-
179
-
180
-
181
-
182
-
183
-
184
-
185
-
186
-
187
-
188
-
189
-
190
-
191
-
192
-
193
-
194
-
195
-
196
-
197
-
198
-
199
-
200
-
201
-
202
-
203
-
204
-
205
-
206
 |
 |

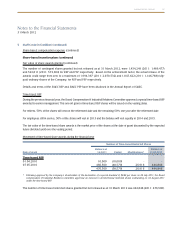
140 SINGAPORE AIRLINES
Notes to the Financial Statements
31 March 2012
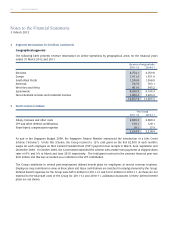
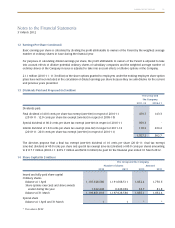
11 Taxation (in $ million) (continued)
The Group has tax losses (of which no deferred tax asset has been recognised) of approximately $53.8 million (2011:
$30.9 million) that are available for offset against future taxable profits of the companies. This is due to the uncertainty
of the recoverability of the deferred tax asset. The use of the tax losses is subject to the agreement of the tax authorities
and compliance with certain provisions of the tax legislation of the respective countries in which the companies operate.
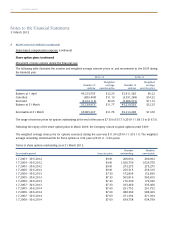
A reconciliation between taxation expense and the product of accounting profit multiplied by the applicable tax rate for
the years ended 31 March is as follows:
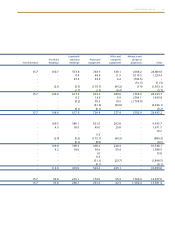
The Group
2011-12 2010-11
Profit before taxation 448.2 1,419.0
Taxation at statutory corporate tax rate of 17.0% 76.2 241.2
Adjustments
Income not subject to tax (19.9) (35.3)
Expenses not deductible for tax purposes 17.3 67.0
Higher effective tax rates of other countries 7.0 6.1
Overprovision in respect of prior years, net (23.2) (5.7)
Income subject to concessionary tax rate (2.4) (4.6)
Tax benefit not recognised 1.0 1.7
Others (4.6) (0.2)
Taxation 51.4 270.2
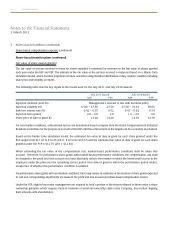
12 Earnings Per Share
The Group
2011-12 2010-11
Basic Diluted Basic Diluted
Profit attributable to owners of the Parent (in $ million) 335.9 335.9 1,092.0 1,092.0
Adjustment for dilutive potential ordinary shares
of subsidiary companies (in $ million) - (1.7) - (2.3)
Adjusted net profit attributable to owners of
the Parent (in $ million) 335.9 334.2 1,092.0 1,089.7
Weighted average number of ordinary shares
in issue (in million) 1,188.8 1,188.8 1,194.9 1,194.9
Adjustment for dilutive potential ordinary shares (in million) - 8.1 - 13.3
Weighted average number of ordinary shares in issue
used for computing earnings per share (in million) 1,188.8 1,196.9 1,194.9 1,208.2
Earnings per share (cents) 28.3 27.9 91.4 90.2