Singapore Airlines 2012 Annual Report Download - page 67
Download and view the complete annual report
Please find page 67 of the 2012 Singapore Airlines annual report below. You can navigate through the pages in the report by either clicking on the pages listed below, or by using the keyword search tool below to find specific information within the annual report.-
 1
1 -
2
-
3
-
4
-
5
-
6
-
7
-
8
-
9
-
10
-
11
-
12
-
13
-
14
-
15
-
16
-
17
-
18
-
19
-
20
-
21
-
22
-
23
-
24
-
25
-
26
-
27
-
28
-
29
-
30
-
31
-
32
-
33
-
34
-
35
-
36
-
37
-
38
-
39
-
40
-
41
-
42
-
43
-
44
-
45
-
46
-
47
-
48
-
49
-
50
-
51
-
52
-
53
-
54
-
55
-
56
-
 57
57 -
 58
58 -
 59
59 -
 60
60 -
 61
61 -
 62
62 -
 63
63 -
 64
64 -
 65
65 -
 66
66 -
 67
67 -
 68
68 -
 69
69 -
 70
70 -
 71
71 -
 72
72 -
 73
73 -
 74
74 -
 75
75 -
 76
76 -
 77
77 -
78
-
79
-
80
-
81
-
82
-
83
-
84
-
85
-
86
-
87
-
88
-
89
-
90
-
91
-
92
-
93
-
94
-
95
-
96
-
97
-
98
-
99
-
100
-
101
-
102
-
103
-
104
-
105
-
106
-
107
-
108
-
109
-
110
-
111
-
112
-
113
-
114
-
115
-
116
-
117
-
118
-
119
-
120
-
121
-
122
-
123
-
124
-
125
-
126
-
127
-
128
-
129
-
130
-
131
-
132
-
133
-
134
-
135
-
136
-
137
-
138
-
139
-
140
-
141
-
142
-
143
-
144
-
145
-
146
-
147
-
148
-
149
-
150
-
151
-
152
-
153
-
154
-
155
-
156
-
157
-
158
-
159
-
160
-
161
-
162
-
163
-
164
-
165
-
166
-
167
-
168
-
169
-
170
-
171
-
172
-
173
-
174
-
175
-
176
-
177
-
178
-
179
-
180
-
181
-
182
-
183
-
184
-
185
-
186
-
187
-
188
-
189
-
190
-
191
-
192
-
193
-
194
-
195
-
196
-
197
-
198
-
199
-
200
-
201
-
202
-
203
-
204
-
205
-
206
 |
 |

065ANNUAL REPORT 2011/2012
Financial Review
2010-11
Q1
2010-11
Q2
2010-11
Q3
2010-11
Q4
2011-12
Q1
2011-12
Q2
2011-12
Q3
2011-12
Q4
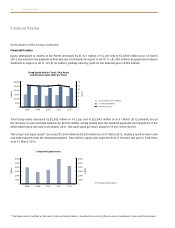
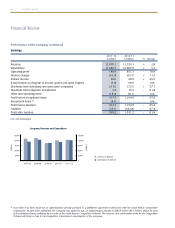
Quarterly Trend of Group Fuel Price
and Fuel Cost (excluding hedging)
1,600 150
1,400 120
1,200 90
1,000 60
$ Million
USD/BBL
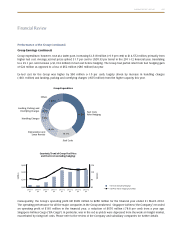
Group Expenditure
Performance of the Group (continued)
Group Earnings (continued)
Group expenditure, however, rose at a faster pace, increasing $1,318 million (+9.9 per cent) to $14,572 million, primarily from
higher fuel cost. Average jet fuel prices spiked 31.7 per cent to USD133 per barrel in the 2011-12 financial year, translating
to a 29.1 per cent increase (+$1,314 million) in fuel cost before hedging. The Group had partial relief from fuel hedging gain
of $24 million as opposed to a loss of $62 million (-$86 million) last year.
Ex-fuel cost for the Group was higher by $90 million (+1.0 per cent), largely driven by increase in handling charges
(+$61 million) and landing, parking and overflying charges (+$55 million) from the higher capacity this year.
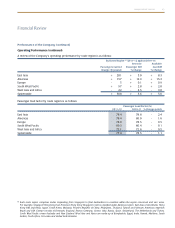
Consequently, the Group’s operating profit fell $985 million to $286 million for the financial year ended 31 March 2012.
The operating performance for all the major companies in the Group weakened. Singapore Airlines (“the Company”) recorded
an operating profit of $181 million in the financial year, a reduction of $670 million (-78.8 per cent) from a year ago.
Singapore Airlines Cargo (“SIA Cargo”), in particular, was in the red as yields were depressed from the weak air freight market,
exacerbated by rising fuel costs. Please refer to the review of the Company and subsidiary companies for further details.
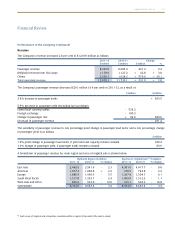
Fuel Costs
After Hedging
Depreciation and
Lease Rentals
Handling Charges
Staff Costs
Landing, Parking and
Overflying Charges
Others
15.1%
14.9%
18.6%
4.6%
7.0%
39.8%