Singapore Airlines 2012 Annual Report Download - page 143
Download and view the complete annual report
Please find page 143 of the 2012 Singapore Airlines annual report below. You can navigate through the pages in the report by either clicking on the pages listed below, or by using the keyword search tool below to find specific information within the annual report.-
 1
1 -
2
-
3
-
4
-
5
-
6
-
7
-
8
-
9
-
10
-
11
-
12
-
13
-
14
-
15
-
16
-
17
-
18
-
19
-
20
-
21
-
22
-
23
-
24
-
25
-
26
-
27
-
28
-
29
-
30
-
31
-
32
-
33
-
34
-
35
-
36
-
37
-
38
-
39
-
40
-
41
-
42
-
43
-
44
-
45
-
46
-
47
-
48
-
49
-
50
-
51
-
52
-
53
-
54
-
55
-
56
-
57
-
58
-
59
-
60
-
61
-
62
-
63
-
64
-
65
-
66
-
67
-
68
-
69
-
70
-
71
-
72
-
73
-
74
-
75
-
76
-
77
-
78
-
79
-
80
-
81
-
82
-
83
-
84
-
85
-
86
-
87
-
88
-
89
-
90
-
91
-
92
-
93
-
94
-
95
-
96
-
97
-
98
-
99
-
100
-
101
-
102
-
103
-
104
-
105
-
106
-
107
-
108
-
109
-
110
-
111
-
112
-
113
-
114
-
115
-
116
-
117
-
118
-
119
-
120
-
121
-
122
-
123
-
124
-
125
-
126
-
127
-
128
-
129
-
130
-
131
-
132
-
 133
133 -
 134
134 -
 135
135 -
 136
136 -
 137
137 -
 138
138 -
 139
139 -
 140
140 -
 141
141 -
 142
142 -
 143
143 -
 144
144 -
 145
145 -
 146
146 -
 147
147 -
 148
148 -
 149
149 -
 150
150 -
 151
151 -
 152
152 -
 153
153 -
154
-
155
-
156
-
157
-
158
-
159
-
160
-
161
-
162
-
163
-
164
-
165
-
166
-
167
-
168
-
169
-
170
-
171
-
172
-
173
-
174
-
175
-
176
-
177
-
178
-
179
-
180
-
181
-
182
-
183
-
184
-
185
-
186
-
187
-
188
-
189
-
190
-
191
-
192
-
193
-
194
-
195
-
196
-
197
-
198
-
199
-
200
-
201
-
202
-
203
-
204
-
205
-
206
 |
 |

141ANNUAL REPORT 2011/2012
Notes to the Financial Statements
31 March 2012
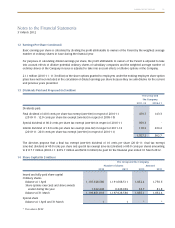
12 Earnings Per Share (continued)
Basic earnings per share is calculated by dividing the profit attributable to owners of the Parent by the weighted average
number of ordinary shares in issue during the financial year.
For purposes of calculating diluted earnings per share, the profit attributable to owners of the Parent is adjusted to take
into account effects of dilutive potential ordinary shares of subsidiary companies and the weighted average number of
ordinary shares of the Company in issue is adjusted to take into account effects of dilutive options of the Company.
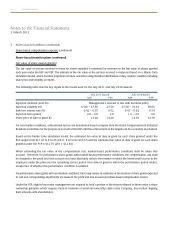
21.1 million (2010-11: 11.3 million) of the share options granted to employees under the existing employee share option
plans have not been included in the calculation of diluted earnings per share because they are anti-dilutive for the current
and previous years presented.
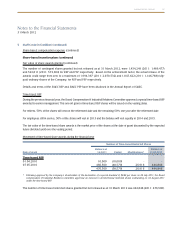
13 Dividends Paid and Proposed (in $ million)
The Group and
the Company
2011-12 2010-11
Dividends paid:
Final dividend of 40.0 cents per share tax exempt (one-tier) in respect of 2010-11 479.7 143.3
(2010-11: 12.0 cents per share tax exempt [one-tier] in respect of 2009-10)
Special dividend of 80.0 cents per share tax exempt (one-tier) in respect of 2010-11 959.3 -
Interim dividend of 10.0 cents per share tax exempt (one-tier) in respect of 2011-12 118.2 239.4
(2010-11: 20.0 cents per share tax exempt [one-tier] in respect of 2010-11)
1,557.2 382.7
The directors propose that a final tax exempt (one-tier) dividend of 10 cents per share (2010-11: final tax exempt
[one-tier] dividend of 40.0 cents per share and special tax exempt [one-tier] dividend of 80.0 cents per share) amounting
to $117.7 million (2010-11: $479.7 million and $959.3 million) be paid for the financial year ended 31 March 2012.
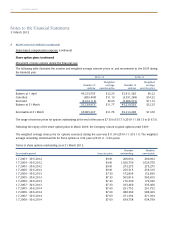
14 Share Capital (in $ million)
The Group and the Company
Number of shares Amount
2012 2011 2012 2011
Issued and fully paid share capital
Ordinary shares
Balance at 1 April 1,197,928,580 1,191,608,511 1,832.4 1,750.6
Share options exercised and share awards
vested during the year 1,922,438 6,320,069 23.7 81.8
Balance at 31 March 1,199,851,018 1,197,928,580 1,856.1 1,832.4
Special share
Balance at 1 April and 31 March 1 1 # #
# The value is $0.50