Singapore Airlines 2012 Annual Report Download - page 70
Download and view the complete annual report
Please find page 70 of the 2012 Singapore Airlines annual report below. You can navigate through the pages in the report by either clicking on the pages listed below, or by using the keyword search tool below to find specific information within the annual report.-
 1
1 -
2
-
3
-
4
-
5
-
6
-
7
-
8
-
9
-
10
-
11
-
12
-
13
-
14
-
15
-
16
-
17
-
18
-
19
-
20
-
21
-
22
-
23
-
24
-
25
-
26
-
27
-
28
-
29
-
30
-
31
-
32
-
33
-
34
-
35
-
36
-
37
-
38
-
39
-
40
-
41
-
42
-
43
-
44
-
45
-
46
-
47
-
48
-
49
-
50
-
51
-
52
-
53
-
54
-
55
-
56
-
57
-
58
-
59
-
 60
60 -
 61
61 -
 62
62 -
 63
63 -
 64
64 -
 65
65 -
 66
66 -
 67
67 -
 68
68 -
 69
69 -
 70
70 -
 71
71 -
 72
72 -
 73
73 -
 74
74 -
 75
75 -
 76
76 -
 77
77 -
 78
78 -
 79
79 -
 80
80 -
81
-
82
-
83
-
84
-
85
-
86
-
87
-
88
-
89
-
90
-
91
-
92
-
93
-
94
-
95
-
96
-
97
-
98
-
99
-
100
-
101
-
102
-
103
-
104
-
105
-
106
-
107
-
108
-
109
-
110
-
111
-
112
-
113
-
114
-
115
-
116
-
117
-
118
-
119
-
120
-
121
-
122
-
123
-
124
-
125
-
126
-
127
-
128
-
129
-
130
-
131
-
132
-
133
-
134
-
135
-
136
-
137
-
138
-
139
-
140
-
141
-
142
-
143
-
144
-
145
-
146
-
147
-
148
-
149
-
150
-
151
-
152
-
153
-
154
-
155
-
156
-
157
-
158
-
159
-
160
-
161
-
162
-
163
-
164
-
165
-
166
-
167
-
168
-
169
-
170
-
171
-
172
-
173
-
174
-
175
-
176
-
177
-
178
-
179
-
180
-
181
-
182
-
183
-
184
-
185
-
186
-
187
-
188
-
189
-
190
-
191
-
192
-
193
-
194
-
195
-
196
-
197
-
198
-
199
-
200
-
201
-
202
-
203
-
204
-
205
-
206
 |
 |

068 SINGAPORE AIRLINES
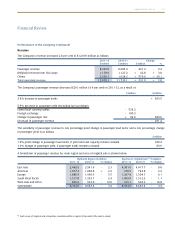
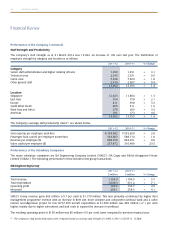
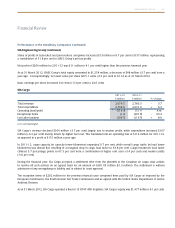
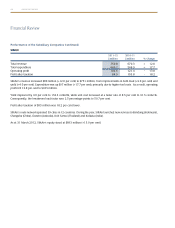
Financial Review
Performance of the Group (continued)
Capital Expenditure and Cash Flow of the Group (continued)
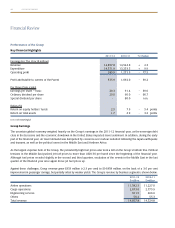
Group Staff Strength and Productivity
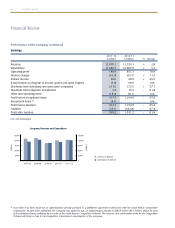
The Group’s staff strength as at 31 March 2012 is as follows:
2011-12 2010-11 % Change
Singapore Airlines 13,992 13,793 + 1.4
SIA Engineering Group 6,166 6,132 + 0.6
SilkAir 1,192 1,116 + 6.8
SIA Cargo 992 954 + 4.0
Others 404 287 + 40.8
R3
22,746 22,282 + 2.1
Average staff productivity are as follows:
2011-12 2010-11 % Change
Revenue per employee ($) 659,936 660,308 - 0.1
Value added per employee ($) 192,960 246,361 - 21.7
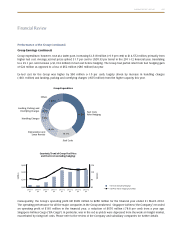
Internally Generated Cash Flow
Group Average Staff Strength and Productivity
$ MillionStaff Number
6,000
40,000
4,500
30,000
3,000
20,000
1,500
10,000
0
0
$ Million $ ‘000
1,500
200
3,000
400
4,500
600
6,000
800
0
0
2007-08
2007-08
2008-09
2008-09
2009-10
2009-10
2010-11
2010-11
2011-12
2011-12
Internally Generated Cash Flow ($ Million)
R3 Other subsidiary companies’ staff strength was up 40.8 per cent, mainly due to Scoot’s 128 staff as at 31 March 2012.
Value Added per Employee ($’000)
Revenue per Employee ($’000)
Staff Strength