Singapore Airlines 2012 Annual Report Download - page 134
Download and view the complete annual report
Please find page 134 of the 2012 Singapore Airlines annual report below. You can navigate through the pages in the report by either clicking on the pages listed below, or by using the keyword search tool below to find specific information within the annual report.-
 1
1 -
2
-
3
-
4
-
5
-
6
-
7
-
8
-
9
-
10
-
11
-
12
-
13
-
14
-
15
-
16
-
17
-
18
-
19
-
20
-
21
-
22
-
23
-
24
-
25
-
26
-
27
-
28
-
29
-
30
-
31
-
32
-
33
-
34
-
35
-
36
-
37
-
38
-
39
-
40
-
41
-
42
-
43
-
44
-
45
-
46
-
47
-
48
-
49
-
50
-
51
-
52
-
53
-
54
-
55
-
56
-
57
-
58
-
59
-
60
-
61
-
62
-
63
-
64
-
65
-
66
-
67
-
68
-
69
-
70
-
71
-
72
-
73
-
74
-
75
-
76
-
77
-
78
-
79
-
80
-
81
-
82
-
83
-
84
-
85
-
86
-
87
-
88
-
89
-
90
-
91
-
92
-
93
-
94
-
95
-
96
-
97
-
98
-
99
-
100
-
101
-
102
-
103
-
104
-
105
-
106
-
107
-
108
-
109
-
110
-
111
-
112
-
113
-
114
-
115
-
116
-
117
-
118
-
119
-
120
-
121
-
122
-
123
-
 124
124 -
 125
125 -
 126
126 -
 127
127 -
 128
128 -
 129
129 -
 130
130 -
 131
131 -
 132
132 -
 133
133 -
 134
134 -
 135
135 -
 136
136 -
 137
137 -
 138
138 -
 139
139 -
 140
140 -
 141
141 -
 142
142 -
 143
143 -
 144
144 -
145
-
146
-
147
-
148
-
149
-
150
-
151
-
152
-
153
-
154
-
155
-
156
-
157
-
158
-
159
-
160
-
161
-
162
-
163
-
164
-
165
-
166
-
167
-
168
-
169
-
170
-
171
-
172
-
173
-
174
-
175
-
176
-
177
-
178
-
179
-
180
-
181
-
182
-
183
-
184
-
185
-
186
-
187
-
188
-
189
-
190
-
191
-
192
-
193
-
194
-
195
-
196
-
197
-
198
-
199
-
200
-
201
-
202
-
203
-
204
-
205
-
206
 |
 |

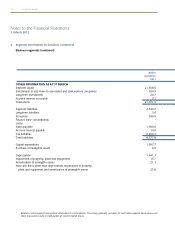
132 SINGAPORE AIRLINES
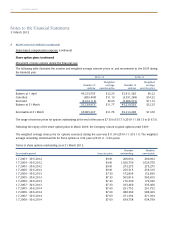
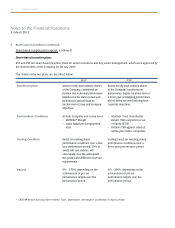
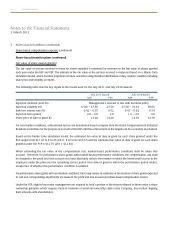
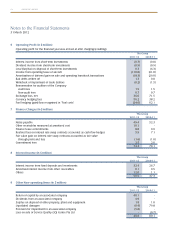
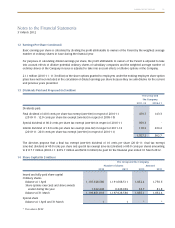
5 Staff Costs (in $ million) (continued)
Share-based compensation expense (continued)
Share option plans (continued)
Movement of share options during the financial year
The following table illustrates the number and weighted average exercise prices of, and movements in, the ESOP during
the financial year:
2011-12 2010-11
Weighted Weighted
Number of average Number of average
options exercise price options exercise price
Balance at 1 April 43,213,533 $12.25 52,411,320 $9.22
Cancelled (859,445) $11.19 (3,531,268) $14.22
Exercised (5,214,115) $9.95 (5,666,519) $11.15
Balance at 31 March 37,139,973 $11.77 43,213,533 $12.25
Exercisable at 31 March 35,865,297 $11.76 39,413,208 $11.00
The range of exercise prices for options outstanding at the end of the year is $7.33 to $15.71 (2010-11: $8.13 to $16.51).
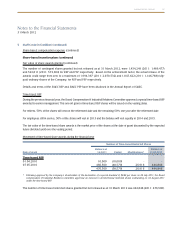
Following the expiry of the share option plans in March 2009, the Company ceased to grant options under ESOP.
The weighted average share price for options exercised during the year was $11.90 (2010-11: $15.11). The weighted
average remaining contractual life for these options is 4.54 years (2010-11: 5.24 years).
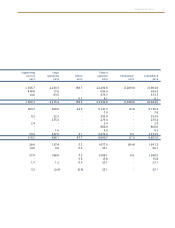
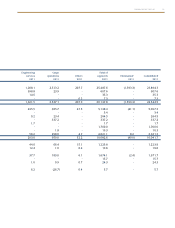
Terms of share options outstanding as at 31 March 2012:
Number Number
Exercisable period Exercise price outstanding exercisable
1.7.2003 - 30.6.2012 $9.81 200,092 200,092
1.7.2004 - 30.6.2012 $9.81 1,026,750 1,026,750
1.7.2005 - 30.6.2012 $9.81 273,275 273,275
1.7.2006 - 30.6.2012 $9.81 256,315 256,315
1.7.2004 - 30.6.2013 $7.33 152,839 152,839
1.7.2005 - 30.6.2013 $7.33 565,819 565,819
1.7.2006 - 30.6.2013 $7.33 179,330 179,330
1.7.2007 - 30.6.2013 $7.33 333,460 333,460
1.7.2005 - 30.6.2014 $7.69 291,752 291,752
1.7.2006 - 30.6.2014 $7.69 988,369 988,369
1.7.2007 - 30.6.2014 $7.69 471,394 471,394
1.7.2008 - 30.6.2014 $7.69 634,758 634,758
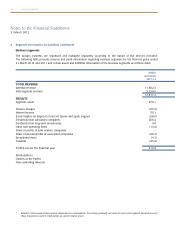
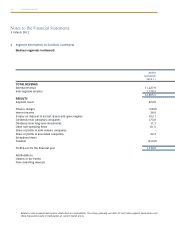
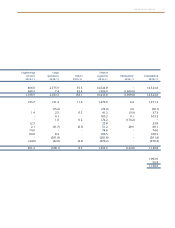
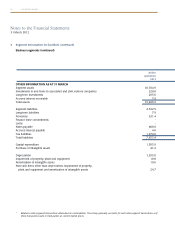
Notes to the Financial Statements
31 March 2012