Singapore Airlines 2012 Annual Report Download - page 178
Download and view the complete annual report
Please find page 178 of the 2012 Singapore Airlines annual report below. You can navigate through the pages in the report by either clicking on the pages listed below, or by using the keyword search tool below to find specific information within the annual report.-
 1
1 -
2
-
3
-
4
-
5
-
6
-
7
-
8
-
9
-
10
-
11
-
12
-
13
-
14
-
15
-
16
-
17
-
18
-
19
-
20
-
21
-
22
-
23
-
24
-
25
-
26
-
27
-
28
-
29
-
30
-
31
-
32
-
33
-
34
-
35
-
36
-
37
-
38
-
39
-
40
-
41
-
42
-
43
-
44
-
45
-
46
-
47
-
48
-
49
-
50
-
51
-
52
-
53
-
54
-
55
-
56
-
57
-
58
-
59
-
60
-
61
-
62
-
63
-
64
-
65
-
66
-
67
-
68
-
69
-
70
-
71
-
72
-
73
-
74
-
75
-
76
-
77
-
78
-
79
-
80
-
81
-
82
-
83
-
84
-
85
-
86
-
87
-
88
-
89
-
90
-
91
-
92
-
93
-
94
-
95
-
96
-
97
-
98
-
99
-
100
-
101
-
102
-
103
-
104
-
105
-
106
-
107
-
108
-
109
-
110
-
111
-
112
-
113
-
114
-
115
-
116
-
117
-
118
-
119
-
120
-
121
-
122
-
123
-
124
-
125
-
126
-
127
-
128
-
129
-
130
-
131
-
132
-
133
-
134
-
135
-
136
-
137
-
138
-
139
-
140
-
141
-
142
-
143
-
144
-
145
-
146
-
147
-
148
-
149
-
150
-
151
-
152
-
153
-
154
-
155
-
156
-
157
-
158
-
159
-
160
-
161
-
162
-
163
-
164
-
165
-
166
-
167
-
 168
168 -
 169
169 -
 170
170 -
 171
171 -
 172
172 -
 173
173 -
 174
174 -
 175
175 -
 176
176 -
 177
177 -
 178
178 -
 179
179 -
 180
180 -
 181
181 -
 182
182 -
 183
183 -
 184
184 -
 185
185 -
 186
186 -
 187
187 -
 188
188 -
189
-
190
-
191
-
192
-
193
-
194
-
195
-
196
-
197
-
198
-
199
-
200
-
201
-
202
-
203
-
204
-
205
-
206
 |
 |

176 SINGAPORE AIRLINES
Notes to the Financial Statements
31 March 2012
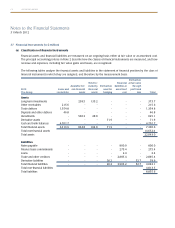
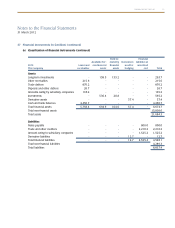
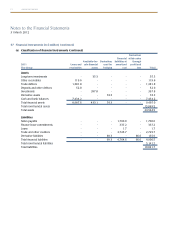
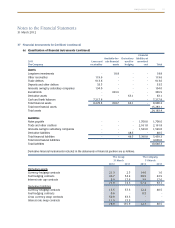
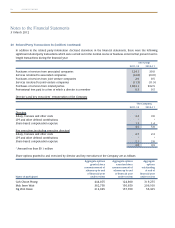
37 FinancialInstruments(in$million)(continued)
(b) Fair values (continued)
Financial instruments carried at other than fair value
Long-term investments classified as available-for-sale amounting to $98.8 million (2011: $35.3 million) for the Group
and $18.8 million (2011: $18.8 million) for the Company are stated at cost because the fair values cannot be obtained
directly from quoted market price or indirectly using valuation techniques supported by observable market data.
Investments classified as held-to-maturity amounting to $164.0 million (2011: nil) for the Group and the Company are
stated at amortised cost. The fair value of these investments as at 31 March 2012 approximate $163.4 million (2011:
nil) for the Group and the Company. Fair value is determined by reference to their published market bid price at the
end of the reporting period.
The Group and the Company have no intention to dispose of their interests in the above investments in the
foreseeable future.
The fair values of long-term liabilities are disclosed in Note 19.
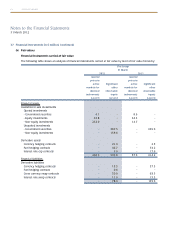
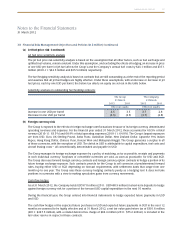
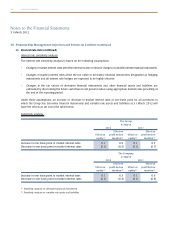
38 Financial Risk Management Objectives and Policies (in $ million)
The Group operates globally and generates revenue in various currencies. The Group’s airline operations carry certain
financial and commodity risks, including the effects of changes in jet fuel prices, foreign currency exchange rates, interest
rates and the market value of its investments. The Group’s overall risk management approach is to moderate the effects of
such volatility on its financial performance. The Group’s policy is to use derivatives to hedge specific exposures.
As derivatives are used for the purpose of risk management, they do not expose the Group to market risk because gains
and losses on the derivatives offset losses and gains on the matching asset, liability, revenues or expenses being hedged.
Moreover, counterparty credit risk is generally restricted to any hedging gain from time to time, and not the principal
amount hedged. Therefore the possibility of a material loss arising in the event of non-performance by a counterparty is
considered to be unlikely.
Financial risk management policies are periodically reviewed and approved by the Board Executive Committee (“BEC”).
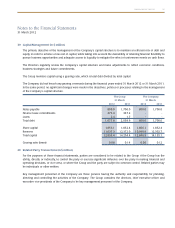
(a) Jet fuel price risk
The Group’s earnings are affected by changes in the price of jet fuel. The Group’s strategy for managing the risk on
fuel price, as defined by BEC, aims to provide the Group with protection against sudden and significant increases in jet
fuel prices. In meeting these objectives, the fuel risk management programme allows for the judicious use of approved
instruments such as swaps and options with approved counterparties and within approved credit limits.
Cash flow hedges
The Group manages this fuel price risk by using swap and option contracts and hedging up to 15 months forward using
jet fuel swap and option contracts.
The Group has applied cash flow hedge accounting to these derivatives as they are considered to be highly effective
hedging instruments. A net fair value loss before tax of $308.1 million (2011: $321.6 million), with a related deferred
tax credit of $91.5 million (2011: $93.8 million), is included in the fair value reserve in respect of these contracts.