Singapore Airlines 2012 Annual Report Download - page 68
Download and view the complete annual report
Please find page 68 of the 2012 Singapore Airlines annual report below. You can navigate through the pages in the report by either clicking on the pages listed below, or by using the keyword search tool below to find specific information within the annual report.-
 1
1 -
2
-
3
-
4
-
5
-
6
-
7
-
8
-
9
-
10
-
11
-
12
-
13
-
14
-
15
-
16
-
17
-
18
-
19
-
20
-
21
-
22
-
23
-
24
-
25
-
26
-
27
-
28
-
29
-
30
-
31
-
32
-
33
-
34
-
35
-
36
-
37
-
38
-
39
-
40
-
41
-
42
-
43
-
44
-
45
-
46
-
47
-
48
-
49
-
50
-
51
-
52
-
53
-
54
-
55
-
56
-
57
-
 58
58 -
 59
59 -
 60
60 -
 61
61 -
 62
62 -
 63
63 -
 64
64 -
 65
65 -
 66
66 -
 67
67 -
 68
68 -
 69
69 -
 70
70 -
 71
71 -
 72
72 -
 73
73 -
 74
74 -
 75
75 -
 76
76 -
 77
77 -
 78
78 -
79
-
80
-
81
-
82
-
83
-
84
-
85
-
86
-
87
-
88
-
89
-
90
-
91
-
92
-
93
-
94
-
95
-
96
-
97
-
98
-
99
-
100
-
101
-
102
-
103
-
104
-
105
-
106
-
107
-
108
-
109
-
110
-
111
-
112
-
113
-
114
-
115
-
116
-
117
-
118
-
119
-
120
-
121
-
122
-
123
-
124
-
125
-
126
-
127
-
128
-
129
-
130
-
131
-
132
-
133
-
134
-
135
-
136
-
137
-
138
-
139
-
140
-
141
-
142
-
143
-
144
-
145
-
146
-
147
-
148
-
149
-
150
-
151
-
152
-
153
-
154
-
155
-
156
-
157
-
158
-
159
-
160
-
161
-
162
-
163
-
164
-
165
-
166
-
167
-
168
-
169
-
170
-
171
-
172
-
173
-
174
-
175
-
176
-
177
-
178
-
179
-
180
-
181
-
182
-
183
-
184
-
185
-
186
-
187
-
188
-
189
-
190
-
191
-
192
-
193
-
194
-
195
-
196
-
197
-
198
-
199
-
200
-
201
-
202
-
203
-
204
-
205
-
206
 |
 |

066 SINGAPORE AIRLINES
Financial Review
Performance of the Group (continued)
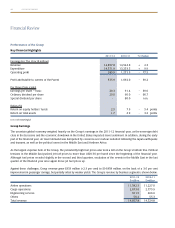
Financial Position
Equity attributable to owners of the Parent decreased by $1,311 million or 9.2 per cent to $12,893 million as at 31 March
2012 due mainly to the payment of final and special dividends in respect of 2010-11 (-$1,439 million) and payment of interim
dividends in respect of 2011-12 (-$118 million), partially offset by profit for the financial year (+$336 million).
Total Group assets decreased by $2,502 million or 10.2 per cent to $22,043 million as at 31 March 2012 primarily due to
the decrease in cash and bank balances by $2,732 million, arising mainly from the dividend payments and repayment of the
$900 million fixed rate note in December 2011. Net asset value per share dropped 7.8 per cent to $10.96.
The Group’s net liquid assetsR1 decreased $1,543 million to $4,250 million as at 31 March 2012, mainly a result of lower cash
and bank balances from the dividend payments. Total debt to equity ratio improved from 0.14 times last year to 0.08 times
as at 31 March 2012.
R1 Net liquid assets is defined as the sum of cash and bank balances, investments, and net of finance lease commitments, loans and bonds issued.
Group Equity Holders’ Fund, Total Assets
and Net Asset Value (NAV) per Share
$ Million
30,000
20,000
25,000
15,000
10,000
5,000
0
Dollars
2
4
6
8
10
12
14
0
2008 2009 2010 2011 2012
Group Net Liquid Assets
$ Million
6,000
4,000
5,000
3,000
2,000
1,000
0
$ Million
1,000
2,000
3,000
4,000
5,000
6,000
0
2008 2009 2010 2011 2012