Singapore Airlines 2012 Annual Report Download - page 132
Download and view the complete annual report
Please find page 132 of the 2012 Singapore Airlines annual report below. You can navigate through the pages in the report by either clicking on the pages listed below, or by using the keyword search tool below to find specific information within the annual report.-
 1
1 -
2
-
3
-
4
-
5
-
6
-
7
-
8
-
9
-
10
-
11
-
12
-
13
-
14
-
15
-
16
-
17
-
18
-
19
-
20
-
21
-
22
-
23
-
24
-
25
-
26
-
27
-
28
-
29
-
30
-
31
-
32
-
33
-
34
-
35
-
36
-
37
-
38
-
39
-
40
-
41
-
42
-
43
-
44
-
45
-
46
-
47
-
48
-
49
-
50
-
51
-
52
-
53
-
54
-
55
-
56
-
57
-
58
-
59
-
60
-
61
-
62
-
63
-
64
-
65
-
66
-
67
-
68
-
69
-
70
-
71
-
72
-
73
-
74
-
75
-
76
-
77
-
78
-
79
-
80
-
81
-
82
-
83
-
84
-
85
-
86
-
87
-
88
-
89
-
90
-
91
-
92
-
93
-
94
-
95
-
96
-
97
-
98
-
99
-
100
-
101
-
102
-
103
-
104
-
105
-
106
-
107
-
108
-
109
-
110
-
111
-
112
-
113
-
114
-
115
-
116
-
117
-
118
-
119
-
120
-
121
-
 122
122 -
 123
123 -
 124
124 -
 125
125 -
 126
126 -
 127
127 -
 128
128 -
 129
129 -
 130
130 -
 131
131 -
 132
132 -
 133
133 -
 134
134 -
 135
135 -
 136
136 -
 137
137 -
 138
138 -
 139
139 -
 140
140 -
 141
141 -
 142
142 -
143
-
144
-
145
-
146
-
147
-
148
-
149
-
150
-
151
-
152
-
153
-
154
-
155
-
156
-
157
-
158
-
159
-
160
-
161
-
162
-
163
-
164
-
165
-
166
-
167
-
168
-
169
-
170
-
171
-
172
-
173
-
174
-
175
-
176
-
177
-
178
-
179
-
180
-
181
-
182
-
183
-
184
-
185
-
186
-
187
-
188
-
189
-
190
-
191
-
192
-
193
-
194
-
195
-
196
-
197
-
198
-
199
-
200
-
201
-
202
-
203
-
204
-
205
-
206
 |
 |

130 SINGAPORE AIRLINES
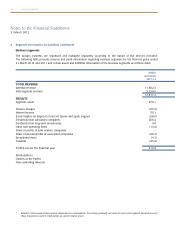
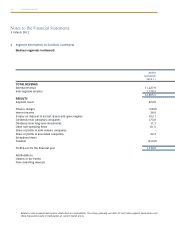
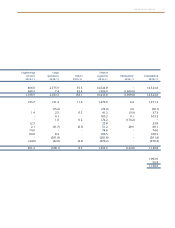
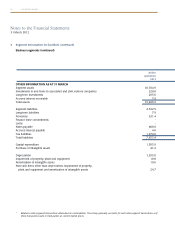
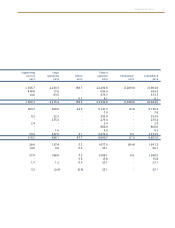
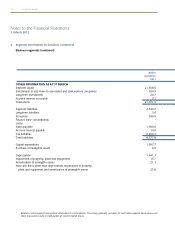
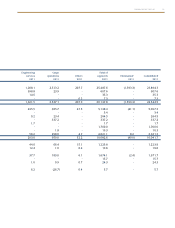
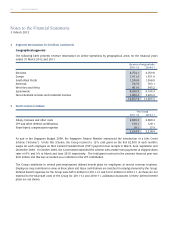
4 Segment Information (in $ million) (continued)
Geographical segments
The following table presents revenue information on airline operations by geographical areas for the financial years
ended 31 March 2012 and 2011.
By area of original sale
2011-12 2010-11
East Asia 4,754.1 4,769.0
Europe 1,411.3 1,551.0
South West Pacific 1,556.6 1,568.0
Americas 747.8 763.1
West Asia and Africa 461.0 545.2
Systemwide 8,930.8 9,196.3
Non-scheduled services and incidental revenue 3,886.4 3,209.2
12,817.2 12,405.5
5 Staff Costs (in $ million)
The Group
2011-12 2010-11
Salary, bonuses and other costs 2,026.2 2,080.4
CPF and other defined contributions 150.1 120.1
Share-based compensation expense 18.1 17.9
2,194.4 2,218.4
As part of the Singapore Budget 2009, the Singapore Finance Minister announced the introduction of a Jobs Credit
Scheme (“Scheme”). Under this Scheme, the Group received a 12% cash grant on the first $2,500 of each month’s
wages for each employee on their Central Provident Fund (“CPF”) payroll in four receipts in March, June, September and
December 2009. In October 2009, the Government extended the scheme with another two payments at stepped-down
rates of 6% and 3% in March and June 2010 respectively. The total grant received in the previous financial year was
$4.0 million and this was accounted as a reduction in the CPF contribution.
The Group contributes to several post-employment defined benefit plans for employees at several overseas locations.
Employees may contribute in some of these plans and these contributions are matched in varying amounts by the Group.
Defined benefit expenses for the Group were $25.9 million for 2011-12 and $13.6 million for 2010-11. As these are not
material to the total staff costs of the Group for 2011-12 and 2010-11, additional disclosures of these defined benefit
plans are not shown.
Notes to the Financial Statements
31 March 2012