Singapore Airlines 2006 Annual Report Download - page 94
Download and view the complete annual report
Please find page 94 of the 2006 Singapore Airlines annual report below. You can navigate through the pages in the report by either clicking on the pages listed below, or by using the keyword search tool below to find specific information within the annual report.-
 1
1 -
2
-
3
-
4
-
5
-
6
-
7
-
8
-
9
-
10
-
11
-
12
-
13
-
14
-
15
-
16
-
17
-
18
-
19
-
20
-
21
-
22
-
23
-
24
-
25
-
26
-
27
-
28
-
29
-
30
-
31
-
32
-
33
-
34
-
35
-
36
-
37
-
38
-
39
-
40
-
41
-
42
-
43
-
44
-
45
-
46
-
47
-
48
-
49
-
50
-
51
-
52
-
53
-
54
-
55
-
56
-
57
-
58
-
59
-
60
-
61
-
62
-
63
-
64
-
65
-
66
-
67
-
68
-
69
-
70
-
71
-
72
-
73
-
74
-
75
-
76
-
77
-
78
-
79
-
80
-
81
-
82
-
83
-
 84
84 -
 85
85 -
 86
86 -
 87
87 -
 88
88 -
 89
89 -
 90
90 -
 91
91 -
 92
92 -
 93
93 -
 94
94 -
 95
95 -
 96
96 -
 97
97 -
 98
98 -
 99
99 -
 100
100 -
 101
101 -
 102
102 -
 103
103 -
 104
104 -
105
-
106
-
107
-
108
-
109
-
110
-
111
-
112
-
113
-
114
-
115
-
116
-
117
-
118
-
119
-
120
-
121
-
122
-
123
-
124
-
125
-
126
-
127
-
128
-
129
-
130
-
131
-
132
-
133
-
134
-
135
-
136
-
137
-
138
-
139
-
140
-
141
-
142
-
143
-
144
-
145
-
146
-
147
-
148
-
149
-
150
-
151
-
152
-
153
-
154
-
155
-
156
 |
 |

92
Singapore Airlines Annual Report 05/06
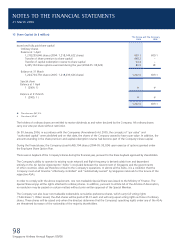
NOTES TO THE FINANCIAL STATEMENTS
31 March 2006
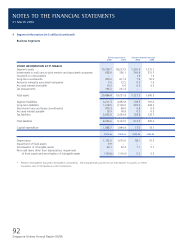
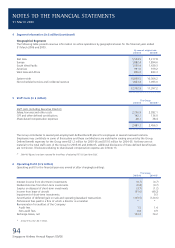
4 Segment Information (in $ million) (continued)
Business Segments
Airline operations Airport terminal services
2006 2005 2006 2005
OTHER INFORMATION AT 31 MARCH
Segment assets 19,258.7 18,223.9 1,365.6 1,215.1
Investments in and loans to joint venture and associated companies 638.6 356.1 345.9 331.7
Goodwill on consolidation – – 1.3 1.3
Long-term investments 403.6 411.3 7.9 50.9
Amounts owing by associated companies 3.0 12.5 0.3 1.0
Accrued interest receivable 14.3 6.6 0.3 0.3
Tax prepayments 166.2 221.4 – –
Total assets 20,484.4 19,231.8 1,721.3 1,600.3
Segment liabilities 4,211.3 4,492.8 178.5 191.0
Long-term liabilities 1,618.5 2,129.0 203.9 204.3
Short-term loans and lease commitments 479.3 68.0 0.8 0.9
Accrued interest payable 18.9 18.8 0.5 0.5
Tax liabilities 2,602.6 2,434.4 128.8 132.7
Total liabilities 8,930.6 9,143.0 512.5 529.4
Capital expenditure 1,988.7 1,984.4 13.0 13.1
2005-06 2004-05 2005-06 2004-05
Depreciation 1,132.0 1,075.0 58.1 57.5
Impairment of fi xed assets 9.9 – – –
Amortisation of intangible assets 40.1 32.3 7.1 5.7
Non-cash items other than depreciation, impairment
of fi xed assets and amortisation of intangible assets (154.6) (116.6) 5.2 5.3
*
Relates to inter-segment transactions eliminated on consolidation. The Group generally accounts for such inter-segment transactions as if these
transactions were to third parties at current market prices.