Singapore Airlines 2006 Annual Report Download - page 59
Download and view the complete annual report
Please find page 59 of the 2006 Singapore Airlines annual report below. You can navigate through the pages in the report by either clicking on the pages listed below, or by using the keyword search tool below to find specific information within the annual report.-
 1
1 -
2
-
3
-
4
-
5
-
6
-
7
-
8
-
9
-
10
-
11
-
12
-
13
-
14
-
15
-
16
-
17
-
18
-
19
-
20
-
21
-
22
-
23
-
24
-
25
-
26
-
27
-
28
-
29
-
30
-
31
-
32
-
33
-
34
-
35
-
36
-
37
-
38
-
39
-
40
-
41
-
42
-
43
-
44
-
45
-
46
-
47
-
48
-
 49
49 -
 50
50 -
 51
51 -
 52
52 -
 53
53 -
 54
54 -
 55
55 -
 56
56 -
 57
57 -
 58
58 -
 59
59 -
 60
60 -
 61
61 -
 62
62 -
 63
63 -
 64
64 -
 65
65 -
 66
66 -
 67
67 -
 68
68 -
 69
69 -
70
-
71
-
72
-
73
-
74
-
75
-
76
-
77
-
78
-
79
-
80
-
81
-
82
-
83
-
84
-
85
-
86
-
87
-
88
-
89
-
90
-
91
-
92
-
93
-
94
-
95
-
96
-
97
-
98
-
99
-
100
-
101
-
102
-
103
-
104
-
105
-
106
-
107
-
108
-
109
-
110
-
111
-
112
-
113
-
114
-
115
-
116
-
117
-
118
-
119
-
120
-
121
-
122
-
123
-
124
-
125
-
126
-
127
-
128
-
129
-
130
-
131
-
132
-
133
-
134
-
135
-
136
-
137
-
138
-
139
-
140
-
141
-
142
-
143
-
144
-
145
-
146
-
147
-
148
-
149
-
150
-
151
-
152
-
153
-
154
-
155
-
156
 |
 |

57
Singapore Airlines Annual Report 05/06
Performance of Subsidiary Companies (continued)
Singapore Airport Terminal Services Group (continued)
Revenue from ground handling, which constituted 46.5 per cent of SATS Group’s total revenue, decreased 1.2 per cent from $438
million to $433 million because of the increased pressure on rates in the current financial year. Revenue from inflight catering,
which constituted 42.5 per cent of SATS Group’s total revenue, went down 6.3 per cent from $423 million to $396 million due to
the loss of Emirates Airlines account with effect from February 2005 as well as due to lower rates. Revenue from aviation security
services decreased 19.2 per cent and revenue from other services increased 5.1 per cent.
Operating expenditure decreased $34 million (-4.3 per cent) to $748 million for the financial year ended 31 March 2006 mainly
due to lower staff costs. Staff costs decreased $25 million (-5.8 per cent) mainly due to savings from restructuring conducted in
the last financial year, lower provision for profit-sharing bonus in 2005-06, lower overtime and allowances in the current year and
a one-time payout of $7 milllion last year due to the renewal of the Collective Agreement.
Operating profit decreased 5.2 per cent (-$10 million) to $184 million.
Profit contribution from overseas through associated companies, which represents 23.3 per cent of SATS Group’s profit before
tax and exceptional item, increased 13.5 per cent to $57 million for the financial year ended 31 March 2006, mainly from
the doubling of equity stake in Asia Airfreight Terminal, and improved profits from the India associated company TAJ SATS Air
Catering.
As at 31 March 2006, SATS Group’s equity holders’ funds was $1,206 million (+13.3 per cent). The increase was mainly
attributable to the profit after tax for the year (+$189 million) and share options exercised (+$28 million). This increase was
partially offset by dividend payments of $50 million and $33 million in August 2005 and November 2005 respectively. Return on
average equity holders’ funds at 16.7 per cent, was 2.0 percentage points lower than 2004-05.
Basic earnings per share improved 1.7 cents to 18.2 cents, while net asset value per share increased $0.12 to $1.15.
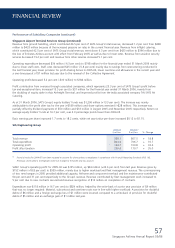
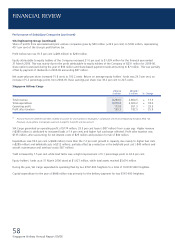
SIA Engineering Group
2005-06 2004-05
R1
$ million $ million % Change
Total revenue 959.1 807.5 + 18.8
Total expenditure 824.4 706.7 + 16.7
Operating profit 134.7 100.8 + 33.6
Profit after taxation 230.4 170.7 + 35.0
R1 Financial results for 2004-05 have been restated to account for share options to employees in compliance with Financial Reporting Standards (FRS) 102.
Previously, share options to employees were not charged to the profit and loss account.
SIAEC Group’s operating profit for 2005-06 was $135 million, up $34 million (+33.6 per cent) from last year. Revenue grew by
$152 million (+18.8 per cent) to $959 million, mainly due to higher workload and fleet management revenue. The commissioning
of two new hangars in 2005 provided additional capacity. Airframe and component overhaul and line maintenance contributed
64 per cent and 31 per cent respectively to the Group’s revenue. Revenue contributed by fleet management work increased to
5 per cent due to new contracts secured and revenue recognition of $12 million on completion of contracts.
Expenditure rose $118 million (+16.7 per cent) to $824 million, helped by the write-back of a prior year provision of $9 million
that was no longer required. Material, subcontract and overtime costs rose in line with higher workload. A provision for doubtful
debts of $6 million and a foreign exchange loss of $1 million were incurred compared to a write-back of provision for doubtful
debts of $5 million and an exchange gain of $1 million last year.
FINANCIAL REVIEW