Singapore Airlines 2006 Annual Report Download - page 51
Download and view the complete annual report
Please find page 51 of the 2006 Singapore Airlines annual report below. You can navigate through the pages in the report by either clicking on the pages listed below, or by using the keyword search tool below to find specific information within the annual report.-
 1
1 -
2
-
3
-
4
-
5
-
6
-
7
-
8
-
9
-
10
-
11
-
12
-
13
-
14
-
15
-
16
-
17
-
18
-
19
-
20
-
21
-
22
-
23
-
24
-
25
-
26
-
27
-
28
-
29
-
30
-
31
-
32
-
33
-
34
-
35
-
36
-
37
-
38
-
39
-
40
-
 41
41 -
 42
42 -
 43
43 -
 44
44 -
 45
45 -
 46
46 -
 47
47 -
 48
48 -
 49
49 -
 50
50 -
 51
51 -
 52
52 -
 53
53 -
 54
54 -
 55
55 -
 56
56 -
 57
57 -
 58
58 -
 59
59 -
 60
60 -
 61
61 -
62
-
63
-
64
-
65
-
66
-
67
-
68
-
69
-
70
-
71
-
72
-
73
-
74
-
75
-
76
-
77
-
78
-
79
-
80
-
81
-
82
-
83
-
84
-
85
-
86
-
87
-
88
-
89
-
90
-
91
-
92
-
93
-
94
-
95
-
96
-
97
-
98
-
99
-
100
-
101
-
102
-
103
-
104
-
105
-
106
-
107
-
108
-
109
-
110
-
111
-
112
-
113
-
114
-
115
-
116
-
117
-
118
-
119
-
120
-
121
-
122
-
123
-
124
-
125
-
126
-
127
-
128
-
129
-
130
-
131
-
132
-
133
-
134
-
135
-
136
-
137
-
138
-
139
-
140
-
141
-
142
-
143
-
144
-
145
-
146
-
147
-
148
-
149
-
150
-
151
-
152
-
153
-
154
-
155
-
156
 |
 |
49
Singapore Airlines Annual Report 05/06
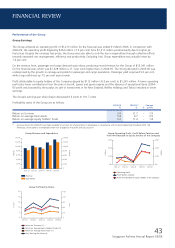
Performance of the Company (continued)
Operating Performance (continued)
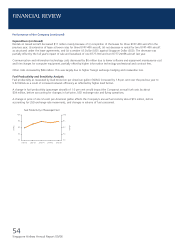
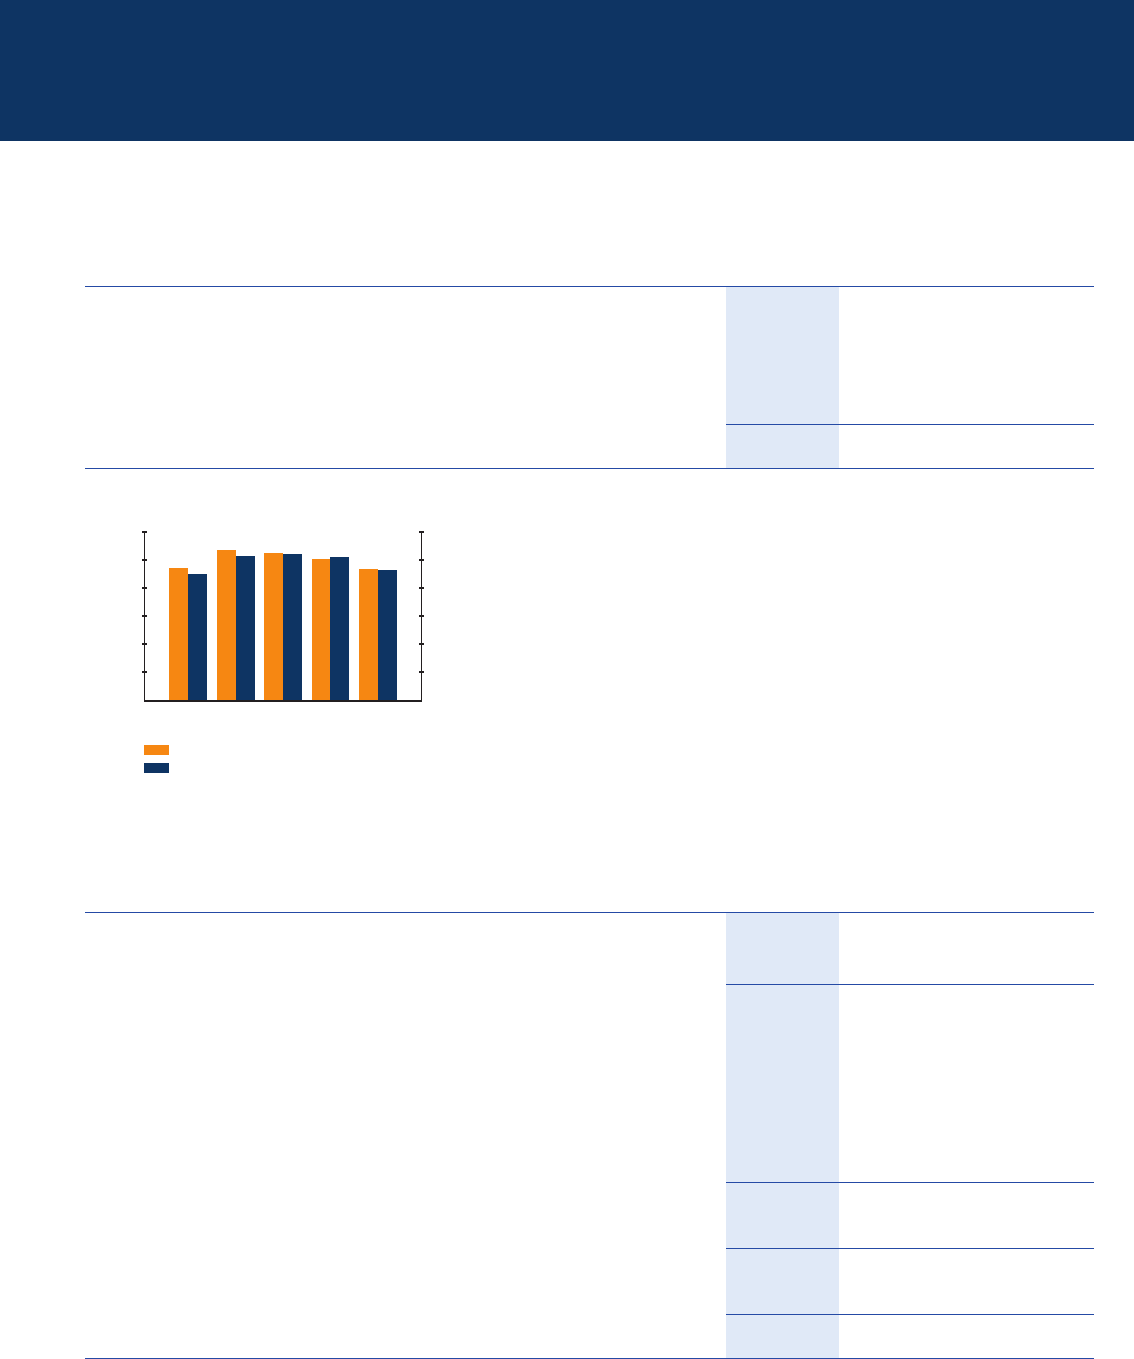
Passenger Load Factor (%)
Change
2005-06 2004-05 % points
East Asia 70.8 67.7 + 3.1
Americas 80.7 77.3 + 3.4
Europe 78.7 78.1 + 0.6
South West Pacific 75.7 77.0 – 1.3
West Asia and Africa 70.5 69.7 + 0.8
Systemwide 75.6 74.1 + 1.5
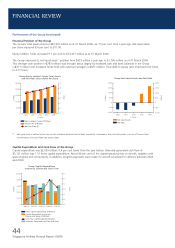
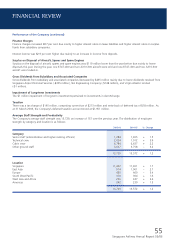
Earnings
2005-06 2004-05
R1
$ million $ million % Change
Revenue 10,302.8 9,260.1 + 11.3
Expenditure (9,651.8) (8,562.2) + 12.7
Operating profit 651.0 697.9 – 6.7
Finance charges (82.8) (59.7) + 38.7
Interest income 92.2 50.4 + 82.9
Surplus on disposal of aircraft, spares and spare engines 58.1 176.7 – 67.1
Surplus on disposal of other fixed assets 10.3 7.9 + 30.4
Dividends from subsidiary and associated companies, gross 201.9 636.4 – 68.3
Dividends from long-term investments, gross 11.1 2.5 n.m.
Impairment of long-term investments (1.0) (11.0) – 90.9
Profit before exceptional items 940.8 1,501.1 – 37.3
Exceptional items – 69.3 n.m.
Profit before taxation 940.8 1,570.4 – 40.1
Taxation expense (194.8) (286.8) – 32.1
Profit after taxation 746.0 1,283.6 – 41.9
R1 Financial results for 2004-05 have been restated to account for share options to employees in compliance with Financial Reporting Standard (FRS) 102. Previously,
share options to employees were not charged to the profit and loss account.
n.m. not meaningful
90
75
60
45
30
15
0
Passenger Load Factor by Route Region
Per cent
Per cent
East Americas Europe South West West Asia
Asia Pacific and Africa
2005-06
2004-05
90
75
60
45
30
15
0
FINANCIAL REVIEW