Singapore Airlines 2006 Annual Report Download - page 45
Download and view the complete annual report
Please find page 45 of the 2006 Singapore Airlines annual report below. You can navigate through the pages in the report by either clicking on the pages listed below, or by using the keyword search tool below to find specific information within the annual report.-
 1
1 -
2
-
3
-
4
-
5
-
6
-
7
-
8
-
9
-
10
-
11
-
12
-
13
-
14
-
15
-
16
-
17
-
18
-
19
-
20
-
21
-
22
-
23
-
24
-
25
-
26
-
27
-
28
-
29
-
30
-
31
-
32
-
33
-
34
-
 35
35 -
 36
36 -
 37
37 -
 38
38 -
 39
39 -
 40
40 -
 41
41 -
 42
42 -
 43
43 -
 44
44 -
 45
45 -
 46
46 -
 47
47 -
 48
48 -
 49
49 -
 50
50 -
 51
51 -
 52
52 -
 53
53 -
 54
54 -
 55
55 -
56
-
57
-
58
-
59
-
60
-
61
-
62
-
63
-
64
-
65
-
66
-
67
-
68
-
69
-
70
-
71
-
72
-
73
-
74
-
75
-
76
-
77
-
78
-
79
-
80
-
81
-
82
-
83
-
84
-
85
-
86
-
87
-
88
-
89
-
90
-
91
-
92
-
93
-
94
-
95
-
96
-
97
-
98
-
99
-
100
-
101
-
102
-
103
-
104
-
105
-
106
-
107
-
108
-
109
-
110
-
111
-
112
-
113
-
114
-
115
-
116
-
117
-
118
-
119
-
120
-
121
-
122
-
123
-
124
-
125
-
126
-
127
-
128
-
129
-
130
-
131
-
132
-
133
-
134
-
135
-
136
-
137
-
138
-
139
-
140
-
141
-
142
-
143
-
144
-
145
-
146
-
147
-
148
-
149
-
150
-
151
-
152
-
153
-
154
-
155
-
156
 |
 |
43
Singapore Airlines Annual Report 05/06
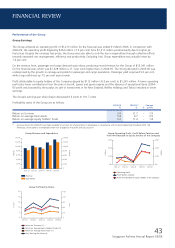
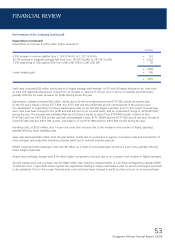
Group Revenue and Expenditure
$ Million
$ Million
2001-02 2002-03 2003-04 2004-05 2005-06
Revenue
Expenditure
14,000
12,000
10,000
8,000
6,000
4,000
2,000
0
14,000
12,000
10,000
8,000
6,000
4,000
2,000
0
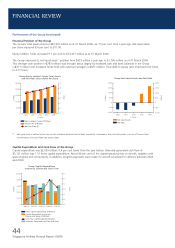
Group Operating Profit, Profit Before Taxation and
Profit Attributable to Equity Holders of the Company
$ Million
$ Million
2001-02 2002-03 2003-04 2004-05 2005-06
Operating Profit
Profit Before Taxation
Profit Attributable to Equity Holders of the Company
2,000
1,500
1,000
500
2,000
1,500
1,000
500
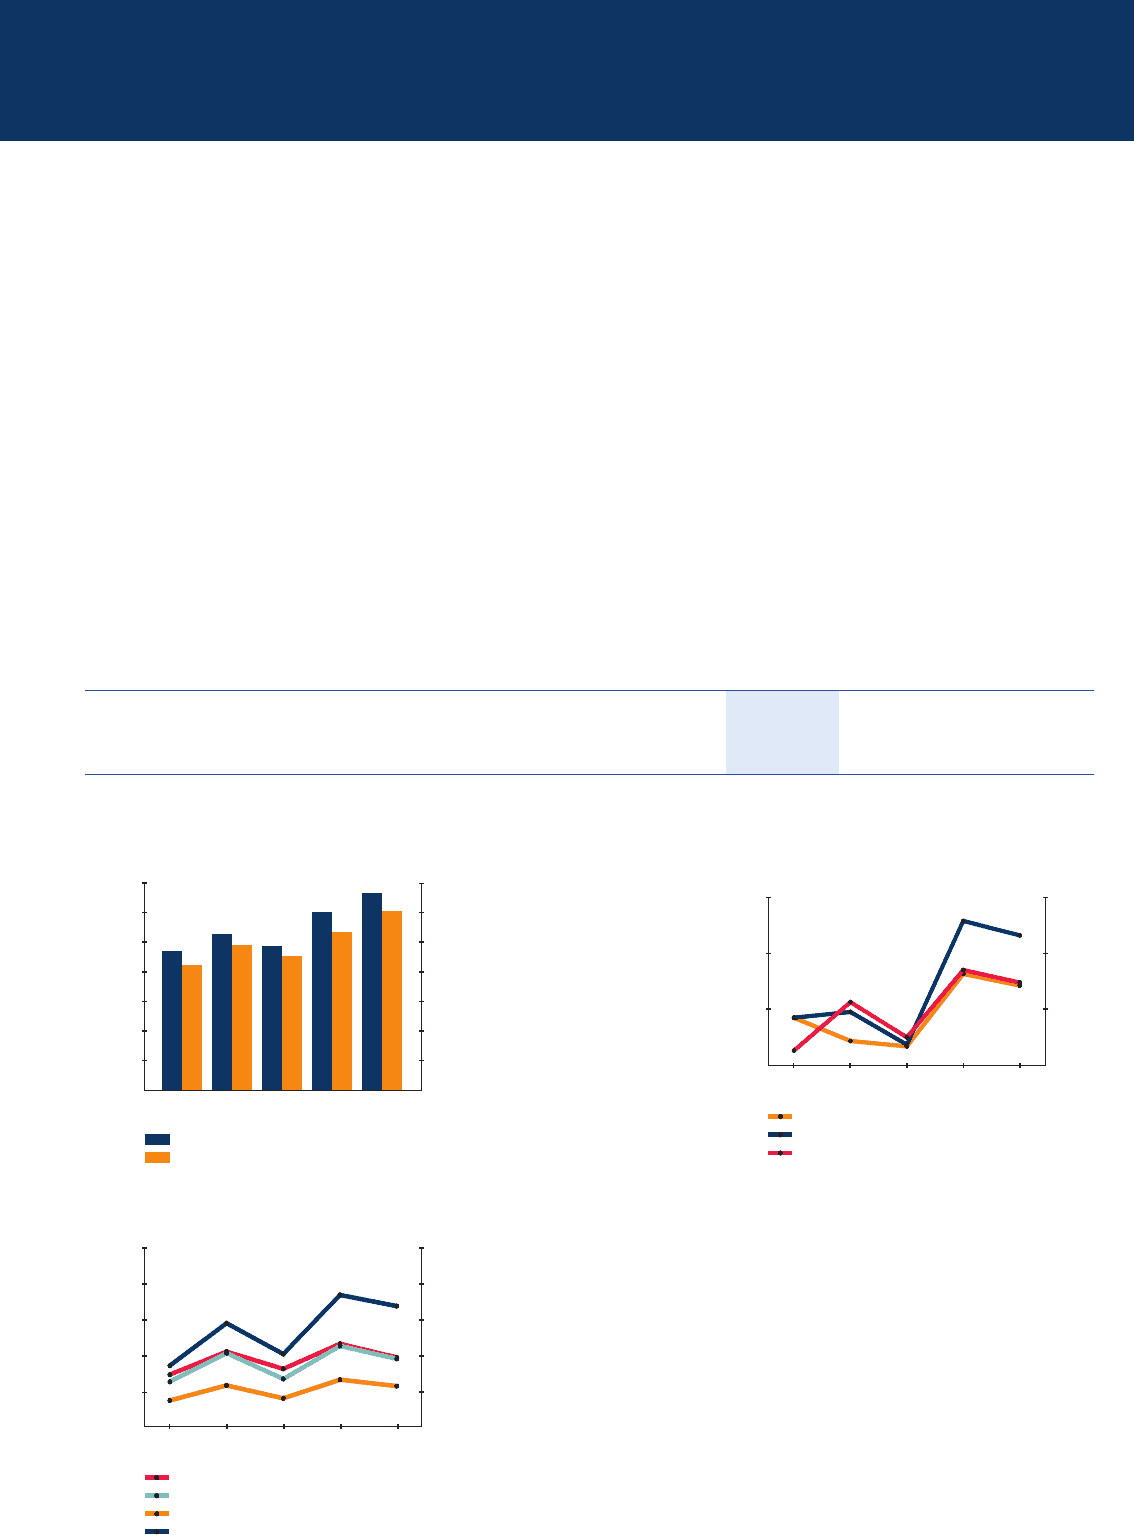
Cents
Per cent
2001-02 2002-03 2003-04 2004-05 2005-06
Return on Turnover (%)
Return on Average Equity Holders’ Funds (%)
Return on Average Total Assets (%)
Basic Earnings Per Share (¢)
25
20
15
10
5
0
0
30
60
90
120
150
Group Profitability Ratios
FINANCIAL REVIEW
Performance of the Group
Group Earnings
The Group achieved an operating profi t of $1,213 million for the fi nancial year ended 31 March 2006. In comparison with
2004-05, the operating profi t dipped by $104 million (-7.9 per cent) from $1,317 million predominantly due to higher jet
fuel prices. Despite the runaway fuel prices, the Group was also able to curb the rise in expenditure through collective efforts
towards improved cost management, effi ciency and productivity. Excluding fuel, Group expenditure was actually lower by
1.4 per cent.
On the revenue front, passenger and cargo demand was robust, producing record revenue for the Group of $13,341 million
for the fi nancial year, which was $1,328 million (+11.1 per cent) higher than in 2004-05. The strong demand in 2005-06 was
underpinned by the growth in carriage and yields for passenger and cargo operations. Passenger yield improved 5.0 per cent
while cargo yield was up 7.5 per cent year-on-year.
Profi t attributable to equity holders of the Company dipped by $112 million (-8.3 per cent) to $1,241 million. A lower operating
profi t plus lower contributions from the sale of aircraft, spares and spare engines and the absence of exceptional items (2004-
05 profi t was boosted by the surplus on sale of investments in Air New Zealand, Raffl es Holdings and Taikoo) resulted in lower
earnings.
The Group’s earnings per share (basic) decreased 9.3 cents to 101.7 cents.
Profitability ratios of the Group are as follows:
2005-06 2004-05
R1 Change
% % % points
Return on turnover 9.8 11.7 – 1.9
Return on average total assets 5.8 6.7 – 0.9
Return on average equity holders’ funds 9.6 11.4 – 1.8
R1 Financial results for 2004-05 have been restated to account for share options to employees in compliance with Financial Reporting Standards (FRS) 102.
Previously, share options to employees were not charged to the profit and loss account.