Singapore Airlines 2006 Annual Report Download - page 46
Download and view the complete annual report
Please find page 46 of the 2006 Singapore Airlines annual report below. You can navigate through the pages in the report by either clicking on the pages listed below, or by using the keyword search tool below to find specific information within the annual report.-
 1
1 -
2
-
3
-
4
-
5
-
6
-
7
-
8
-
9
-
10
-
11
-
12
-
13
-
14
-
15
-
16
-
17
-
18
-
19
-
20
-
21
-
22
-
23
-
24
-
25
-
26
-
27
-
28
-
29
-
30
-
31
-
32
-
33
-
34
-
35
-
 36
36 -
 37
37 -
 38
38 -
 39
39 -
 40
40 -
 41
41 -
 42
42 -
 43
43 -
 44
44 -
 45
45 -
 46
46 -
 47
47 -
 48
48 -
 49
49 -
 50
50 -
 51
51 -
 52
52 -
 53
53 -
 54
54 -
 55
55 -
 56
56 -
57
-
58
-
59
-
60
-
61
-
62
-
63
-
64
-
65
-
66
-
67
-
68
-
69
-
70
-
71
-
72
-
73
-
74
-
75
-
76
-
77
-
78
-
79
-
80
-
81
-
82
-
83
-
84
-
85
-
86
-
87
-
88
-
89
-
90
-
91
-
92
-
93
-
94
-
95
-
96
-
97
-
98
-
99
-
100
-
101
-
102
-
103
-
104
-
105
-
106
-
107
-
108
-
109
-
110
-
111
-
112
-
113
-
114
-
115
-
116
-
117
-
118
-
119
-
120
-
121
-
122
-
123
-
124
-
125
-
126
-
127
-
128
-
129
-
130
-
131
-
132
-
133
-
134
-
135
-
136
-
137
-
138
-
139
-
140
-
141
-
142
-
143
-
144
-
145
-
146
-
147
-
148
-
149
-
150
-
151
-
152
-
153
-
154
-
155
-
156
 |
 |
44
Singapore Airlines Annual Report 05/06
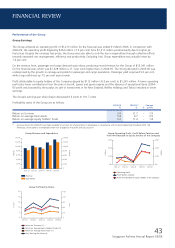
Performance of the Group (continued)
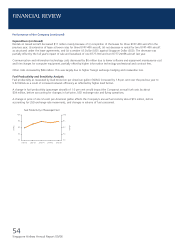
Financial Position of the Group
The Group’s total assets stood at $23,370 million as at 31 March 2006, up 7.5 per cent from a year ago. Net asset value
per share improved 8.6 per cent to $11.00.
Equity holders’ funds increased 9.1 per cent to $13,471 million as at 31 March 2006.
The Group improved its net liquid asset R1 position from $923 million a year ago to $1,706 million as at 31 March 2006.
This stronger cash position (+$783 million) was brought about largely by increased cash and bank balances in the Group
(+$311 million) and increased funds held with external managers (+$367 million). Total debt to equity ratio improved 0.02 times
to 0.17 times.
R1 Net liquid asset is defined as the sum of cash and bank balances (net of bank overdrafts), investments, loans to third parties, and net of finance lease
commitments, loans and fixed rate notes issued.
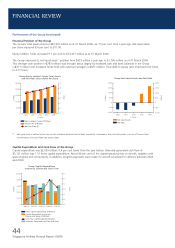
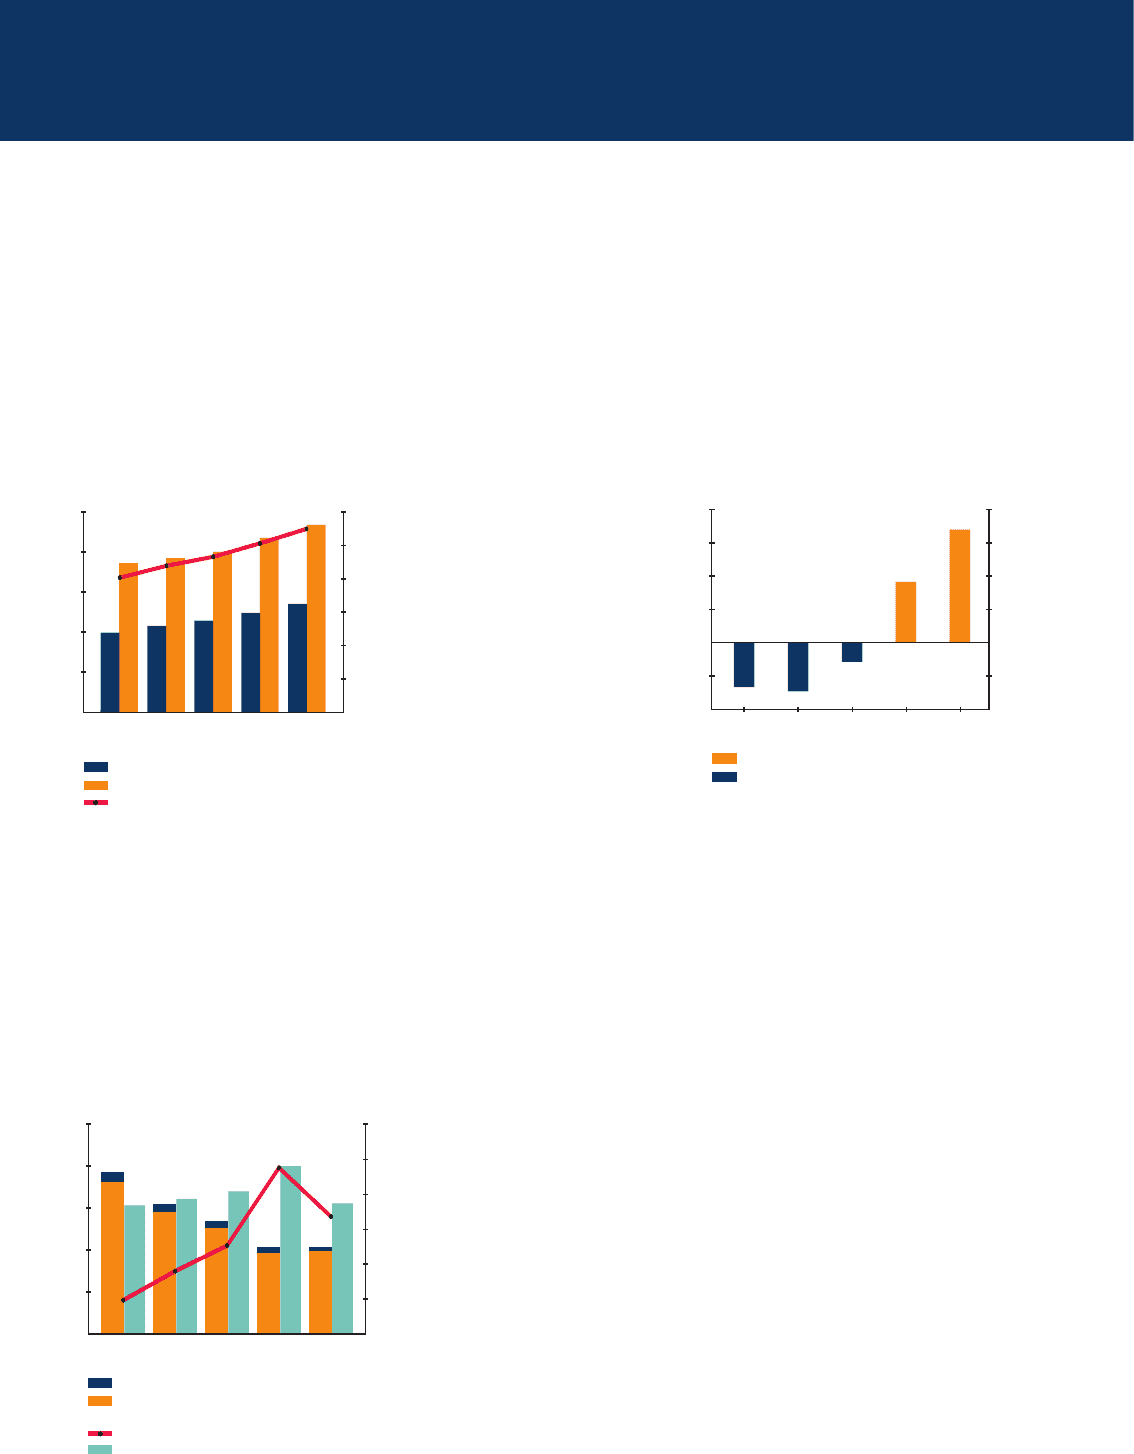
Capital Expenditure and Cash Flow of the Group
Capital expenditure was $2,059 million, 0.4 per cent lower than the year before. Internally generated cash fl ow of
$3,101 million was 1.51 times capital expenditure. About 96 per cent of the capital spending was on aircraft, together with
spare engines and components. In addition, progress payments were made for aircraft scheduled for delivery between 2006
and 2009.
2.3
2.0
1.7
1.4
1.1
0.8
0.5
Ratio
$ Million
Other Capital Expenditure ($ Million)
Capital Expenditure on Aircraft,
Engines and Spares ($ Million)
Cash Flow: Capital Expenditure Ratio
Internally Generated Cash Flow ($ Million)
5,000
4,000
3,000
2,000
1,000
0
2001-02 2002-03 2003-04 2004-05 2005-06
Group Capital Expenditure
Internally Generated Cash Flow
FINANCIAL REVIEW
12
10
8
6
4
2
0
Group Equity Holders’ Funds, Total Assets
and Net Asset Value (NAV) Per Share
Dollars
$ Million
2002 2003 2004 2005 2006
31 March
Equity Holders’ Funds ($ Million)
Total Assets ($ Million)
NAV Per Share ($)
25,000
20,000
15,000
10,000
5,000
0
2,000
1,500
1,000
500
0
-500
-1,000
Group Net Liquid Assets and Net Debt
$ Million
$ Million
2002 2003 2004 2005 2006
31 March
Net Liquid Assets
Net Debt
2,000
1,500
1,000
500
0
-500
-1,000